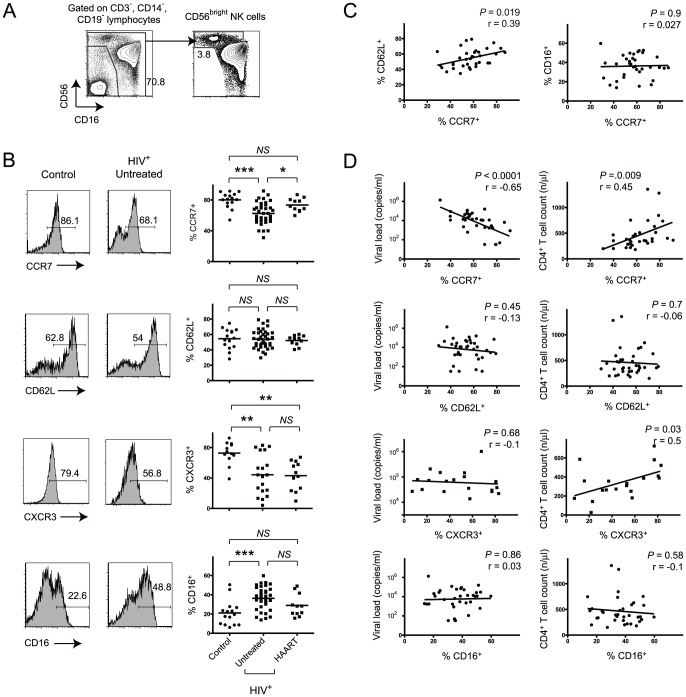
Figure 1. Loss of CCR7-expressing CD56bright NK cells correlates with clinical disease markers.
(A) Representative flow cytometry plots defining CD56bright NK cells. Numbers indicate percentage of the gated population. (B) Representative CCR7, CD62L, CXCR3 and CD16 expression data and summary data all gated on CD56bright NK cells. Horizontal bars in dot plot indicate mean values. (C) Pearson’s correlation analysis between frequencies of either CD62L+ or CD16+CD56bright NK cells and CCR7+CD56bright NK cells in untreated HIV-seropositive patients. (D) Pearson’s correlation analysis between frequencies of CCR7+, CD62L+, CXCR3+ or CD16+ cells of total CD56bright NK cells with either viral load or CD4+ T cell counts in untreated HIV-positive subjects. *, P<0.05; ***, P<0.001; NS – not significant.

