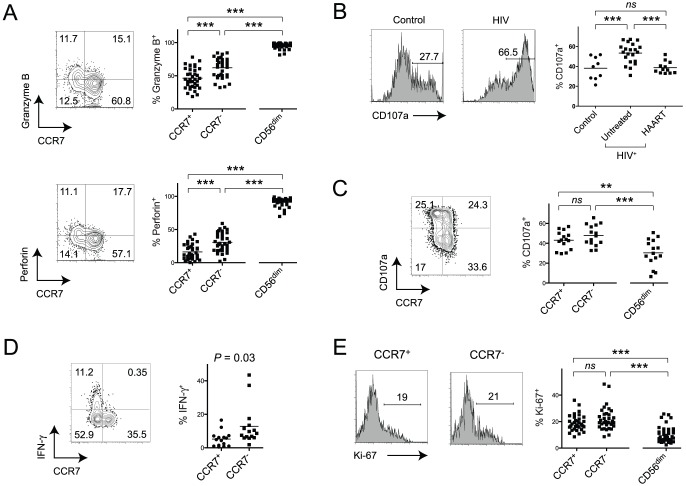
Figure 4. Functional differences between CCR7.
− and CCR7+CD56bright NK cells from HIV-infected donors indicate high activation states. (A) Representative flow cytometry plots of granzyme B and perforin expression on gated CD56bright NK cells and summary data including CD56dimCD16+ cells, from untreated HIV-infected subjects. Horizontal bars in dot plots show mean values. Numbers in corners represent percentage of quadrant. (B) Representative histograms and summary data of CD107a degranulation in CD56bright cells from uninfected controls, untreated and HAART-treated HIV-patients. Data was generated using sorted NK cells stimulated with IL-12, IL-15 and K452 cells. (C) Representative flow cytometry plot of CD107a degranulation on gated CD56bright NK cells and summary data of degranulation in CCR7+CD56bright, CCR7−CD56bright and CD56dim NK cells from untreated HIV-infected subjects is shown. Data was generated using whole PBMCs stimulated with IL-12, IL-15 and K562 cells. Numbers in corners represent percentage of quadrant. (D) Spontaneous expression of IFN-γ in medium-only treated NK cell subsets is shown in a representative flow cytometry plot and a summary data graph. Data from untreated HIV-positive patients is shown and numbers in corners indicate percentages of quadrants. (E) Representative Ki-67-expression data and summary data on gated CCR7+ or CCR7− CD56bright cells and respective summary data including CD56dimCD16+ NK cells from untreated HIV-seropositive subjects. Numbers in flow cytometry histogram plots indicate percentage of gated events. ***, P<0.001; NS – not significant.

