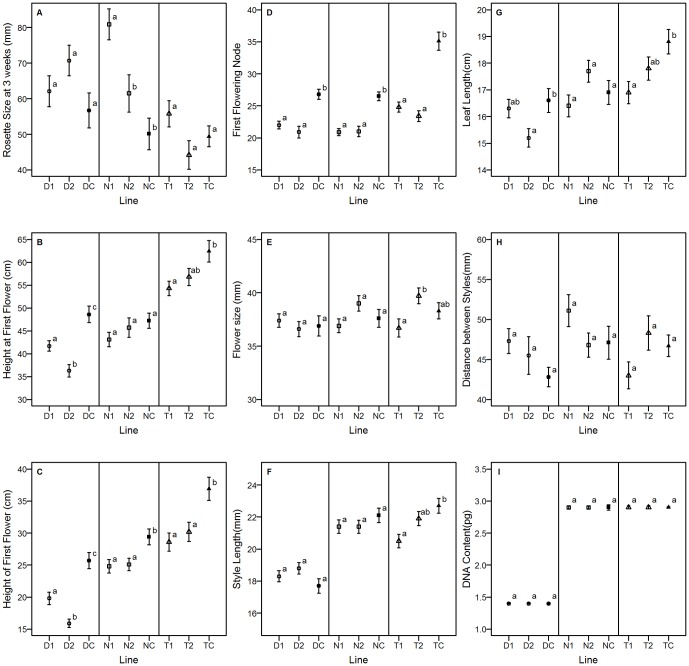
Figure 2. Correlated responses to selection.
Correlated responses to selection across lines within ploidies for the fourth generation (D1, D2 = Diploid line 1 and 2, DC = Diploid Control; N1, N2 = Neoautotetraploid line 1 and 2, NC = Neoautotetraploid Control; T1, T2 = Extant Autotetraploid line 1 and 2, TC = Extant Autotetraploid Control). Means with standard error bars are presented with different letters indicating significant differences at the p<0.05 level or less using Tukey's HSD within the ploidy for A) rosette size three weeks after planting (mm), B) total plant height at first flower (cm), C) height of first flower (cm), D) number of nodes produced before the first node with a flower, E) flower size across opposite petals (mm), F) style length from the base of the flower to end of fully reflexed stigma (mm), G) leaf length from stem to tip (cm), H) distance between styles of fully opened adjacent flowers (mm), and I) DNA content as measured by flow cytometry (pg).

