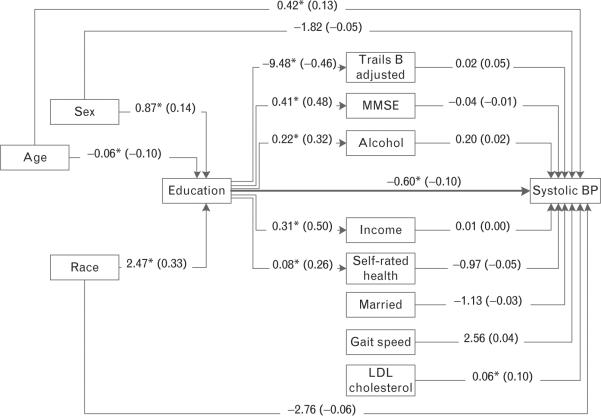
FIGURE 1.
Path diagram estimating direct and indirect effects from education to SBP (Maintenance of Balance, Independent Living, Intellect, and Zest in the Elderly Boston Study). Regression coefficients are interpretable as the average difference in the outcome per unit difference in the predictor. The direct effect between education and SBP [β = −0.60 mmHg per year of education, 95% confidence interval (CI): −1.15 to −0.06] is shown in the Figure. Indirect effects are associations between education and blood pressure (BP) that occur through mediating variables and were not statistically significant (nonstandardized indirect effect= −0.19 mmHg per year of education, 95% CI: −0.59 to 0.20; not shown in Figure). The sum of direct and indirect effects is the total effect (nonstandardized total effect= −0.80 mmHg per year of education, 95% CI: −1.28 to −0.32; not shown in Figure). Values shown on lines are raw (standardized) regression coefficients. *P < 0.05. BP, blood pressure; HTN, hypertension; LDL, Low-density lipoprotein cholesterol; MMSE, Mini-Mental State Examination.

