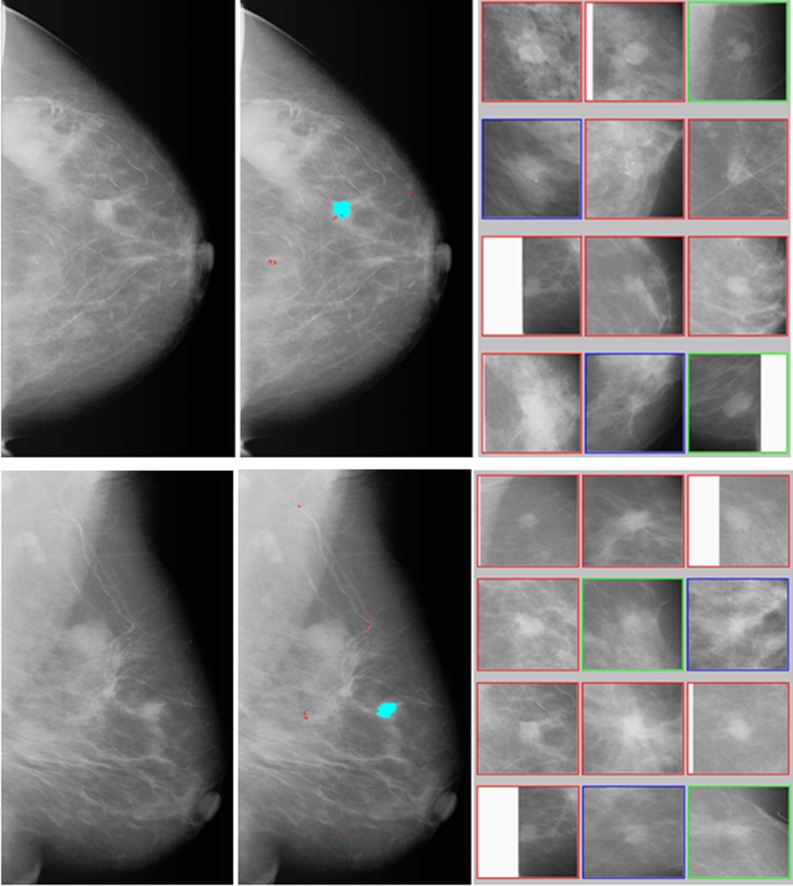
Fig. 2.
An example of applying the interactive CAD system to process two images (CC and MLO view of one breast) where the left column shows the originally digitized mammograms, the middle column shows the images with CAD-cueing results (with one cued mass and several cued micro-calcification clusters), the right column shows two sets of 12 CBIR-selected reference ROIs depicting the similar mass regions to the CAD-cued mass regions. By counting horizontally row-by-row from the top left ROI (1) to the bottom right ROI (12), the reference image set of CC view includes eight ROIs (1, 2, and 5–10) depicting malignant masses, two ROIs (3 and 12) depicting benign masses, and two ROIs (4 and 11) depicting CAD-cued false-positive regions, while the reference set of MLO view includes eight malignant ROIs (1–4 and 7–10), two benign ROIs (5 and 12), and two CAD-cued false-positive ROIs (6 and 11)

