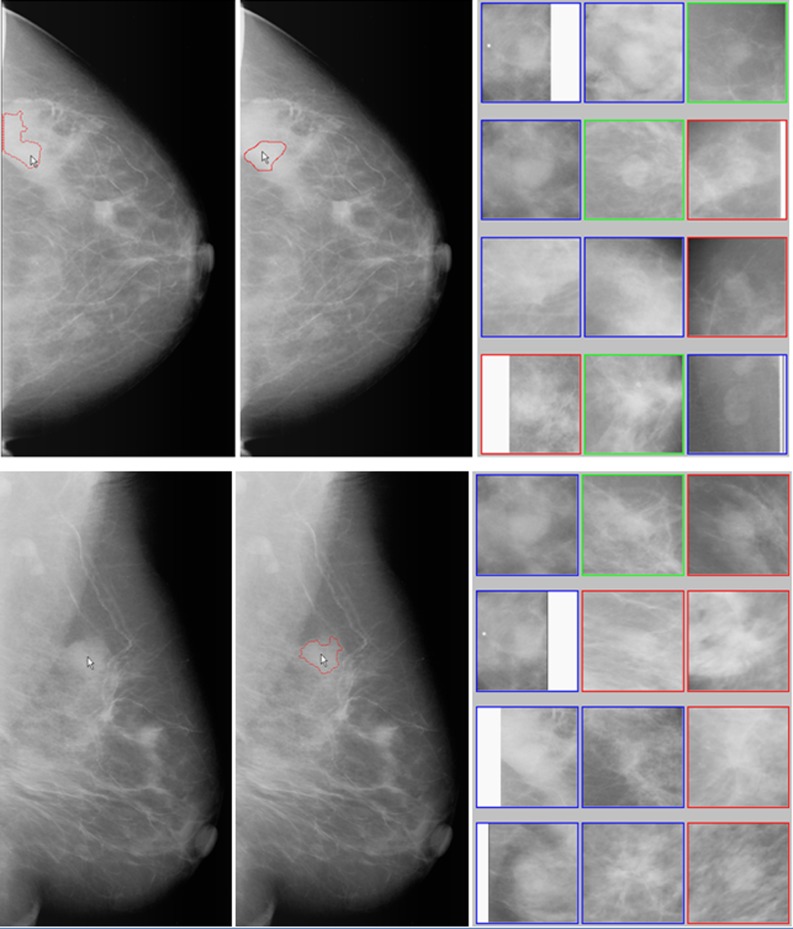
Fig. 3.
An example of manually querying any suspicious mass regions not cued by the conventional CAD scheme. Two images in the left column show queried regions (pointed by the arrows) and the failed automated segmentation result in CC view image. Two images in middle column show the manually defined (CC view image) and automated segmented (MLO view image) suspicious region boundary contour. The right column show two sets of 12 CBIR algorithm selected most similar reference ROIs. By counting horizontally row-by-row from the top left ROI (1) to the bottom right ROI (12), the reference image set of CC view includes three ROIs (6, 9, and 10) depicting malignant masses, three ROIs (3, 5, and 11) depicting benign masses, and six ROIs (1, 2, 4, 7, 8, and 12) depicting CAD-cued false-positive regions, while the reference image set of MLO view includes five malignant ROIs (3, 5, 6, 9, and 12), one benign ROI (2), and six CAD-cued false-positive ROIs (1, 4, 7, 8, 10, and 11)

