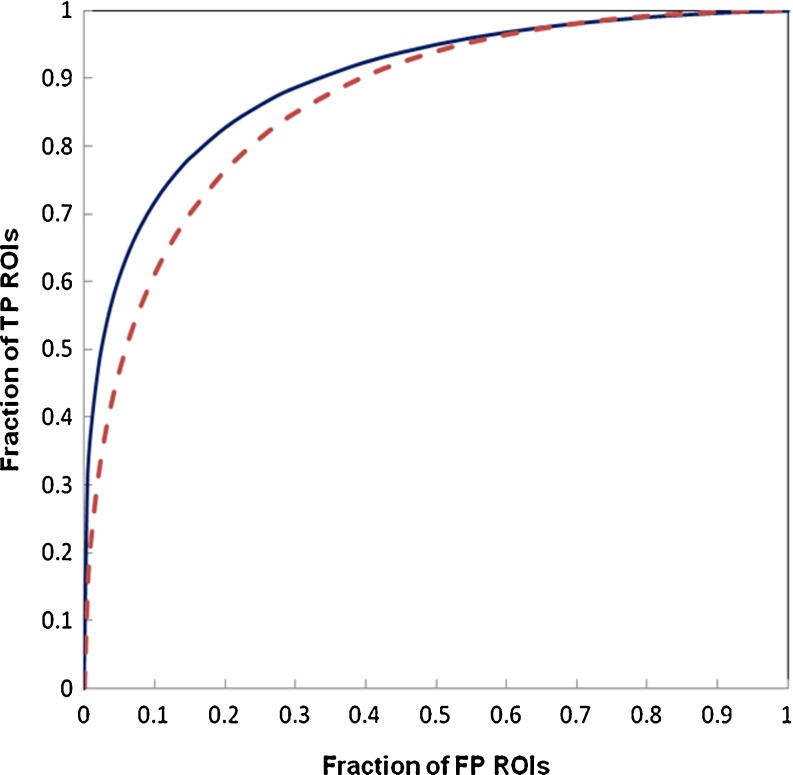
Fig. 4.
Comparison of two ROC-type performance curves of our interactive CAD scheme evaluated using a leave-one-out testing method involving 3,600 ROIs in the reference database. One curve (solid line) was generated using a new KNN algorithm with an attribute stretching function (AUC = 0.897 ± 0.005) and another curve (dashed line) was generated using the original KNN algorithm with equally weighted attributes (AUC = 0.865 ± 0.006)

