Figure 6.
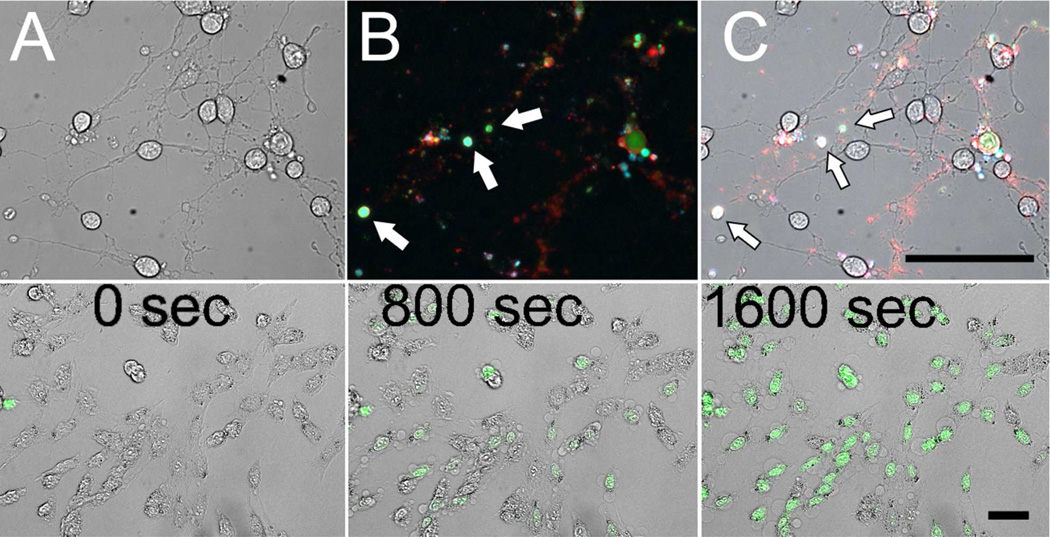
Transmitted light image of RGC-5 cells undergoing SS-induced apoptosis (5 µM SS, 3 hrs) (A). Overlay of fluorescence microscopy images of RGC-5 cells undergoing SS-induced apoptosis with concurrent propidium iodide staining (pseudocolor blue), 3 (10 µM) activation (pseudocolor green) and Alexa Fluor 647-annexin V staining (pseudocolor red) (B). Overlay of panels A and B (C). Arrows denote apoptotic bodies (B and C). Transmitted light and fluorescence microscopy overlay images taken from a time lapse movie of 3 (5 µM) activation in RGC-5 cells following exposure to ionomycin (20 µM) (bottom row). Times correspond to movie acquisition time (sec). Image acquisition began 1 minute following ionomycin exposure (50 µm scale bars).

