

Abstract
A single previous study has demonstrated significant association of psoriasis with copy number of beta-defensin genes, using DNA from psoriasis cases and controls from Nijmegen and Erlangen. In this study we attempted to replicate that finding in larger new cohorts from Erlangen (N = 2017) and Michigan (N = 5412), using improved methods for beta-defensin copy number determination based on the paralog ratio test (PRT), and enhanced methods of analysis and association testing implemented in the CNVtools resource. We demonstrate that the association with psoriasis found in the discovery sample is maintained after applying improved typing and analysis methods (p = 5.5 × 10⁻⁴, OR = 1.25). We also find that the association is replicated in 2616 cases and 2526 controls from Michigan, although at reduced significance (p = 0.014), but not in new samples from Erlangen (1396 cases and 621 controls, p = 0.38). Meta-analysis across all cohorts suggests a nominally significant association (p = 6.6 × 10⁻³/2 × 10−4) with an effect size (OR = 1.081) much lower than found in the discovery study (OR = 1.32). This reduced effect size and significance on replication is consistent with a genuine but weak association.
Introduction
Psoriasis is a common and chronic inflammatory disease of the skin found at high frequency in European populations. Cellular features of psoriasis include changes to keratinocyte differentiation and epidermal hyperplasia, and there is strong evidence for the role of immune, inflammatory and genetic factors predisposing individuals to disease. A very strong association of psoriasis with HLA-Cw6 (PSORS1) has long been established, providing unambiguous evidence of the importance of genetic variation in psoriasis. Although PSORS1 harbors the strongest genetic risk factor, it is clear that many other loci contribute to genetic susceptibility. Several laboratories recently performed well-powered genome-wide association studies (GWAS) of psoriasis and in addition to confirming previously known loci, were able to establish genome-wide significant association for 20 new psoriasis susceptibility loci, many of which contained genes with functions in the immune system and inflammation (Capon et al., 2008; Cargill et al., 2007; de Cid et al., 2009; Ellinghaus et al., 2010; Genetic Analysis of Psoriasis Consortium et al., 2010; Hüffmeier et al., 2010; Nair et al., 2009; Stuart et al., 2010; Sun et al., 2010; Zhang et al., 2009). Among the loci identified in GWAS, one risk factor is defined by a copy number variant (CNV), a deletion of the LCE3B and LCE3C genes important in establishing the skin's barrier functions (de Cid et al., 2009).
A cluster of seven human beta-defensin genes on chromosome 8, including DEFB4, DEFB103-107 and SPAG11, but excluding DEFB1, display extensive variation in copy number. Copy numbers commonly range between 2 and 7 copies in European populations, with occasional examples of copy numbers as high as 10 or 12, and the repeat unit appears coherent, with all copy-variable genes having equal copy number in each individual (Groth et al., 2008; Hollox et al., 2003; Linzmeier and Ganz, 2005). Copy numbers in the range of 2–7 per diploid genome create real challenges for accurate typing, and for multi-allelic CNVs in particular, the precision and reliability of copy number measurement is a key factor in ensuring that association findings are robust (Aldhous et al., 2010; McCarroll, 2008). The hBD-2 peptide can be found at very high levels in psoriatic plaques, and it is natural to hypothesize that copy number variation of the gene DEFB4, encoding hBD-2, might be a genetic factor in predisposition to psoriasis. In 2008 Hollox et al. (Hollox et al., 2008) published a study of samples from 179 Dutch cases and 272 controls, and 319 German psoriasis patients and 305 controls. In both cohorts they found significantly elevated mean copy number in cases relative to controls (p < 10−4 in both cohorts), consistent with a linear-effect model in which each additional repeat unit multiplies the risk of psoriasis by an odds ratio of about 1.3. Using improved statistical approaches, Barnes et al. reanalyzed the data from Hollox et al., concluding that while there was some evidence for differential bias in the typing of the German samples, the underlying association appeared to be valid (Barnes et al., 2008).
This finding, which is of great interest in the pathogenesis of psoriasis, is based on relatively small sample sizes, and no published study has yet attempted to replicate this finding independently. Here we attempt to replicate the association results using DNA samples from more than 4000 psoriasis cases (predominantly chronic plaque or guttate psoriasis, and including psoriatic arthritis, see Supplementary Material, section F) and 3000 controls from two centers; we also retyped and analyzed most of the samples from the original study using improved CNV measurement methods.
Results
Copy number determination: quality parameters
Where genotyping is error-prone, there are opposite dangers in either accepting all data without selection (“uncensored”) or in applying a quality threshold, and accepting only data passing the threshold (“censored”). In the particular case of the beta-defensin genes, one would expect measurement error to be most problematic at high copy number, and therefore that the application of a strict quality threshold would preferentially remove samples at the high end of the range. If applied differentially to cases and controls, censoring could create an artifactual association with copy number. For this reason, we show results from uncensored data in this report, but for completeness we have also analysed the corresponding censored data, summarised in the Supplementary Material. The overall conclusions from our work are not strongly affected by the choice of censored or uncensored data (Tables S1 and S2).
Association testing
Bar graphs of the most likely copy numbers from the fitting procedure for uncensored data are shown in Figure 1 (with corresponding distributions for censored data in Figure S3). These bar graphs are for illustrative purposes only; these integer assignments are not used for the actual association tests, which incorporate posterior probabilities across all possible copy numbers along with uncertainties in the probabilities themselves. These bar graphs give the impression that there are relatively strong positive associations between psoriasis and defensin copy number in the original Erlangen and all Nijmegen samples, modest positive associations in the Michigan sample and the full Erlangen sample, and no association in the new Erlangen sample.
Figure 1. Distributions of copy number values for beta-defensins.
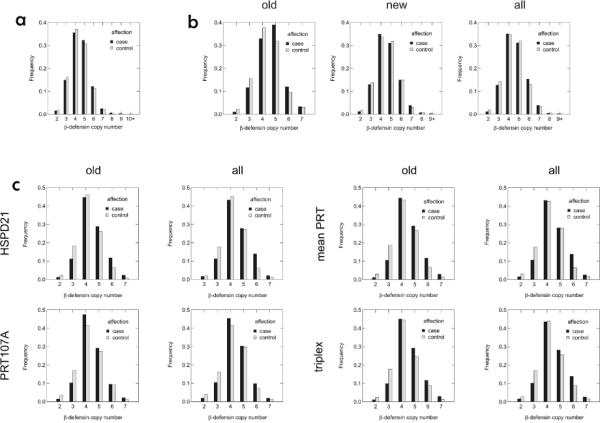
Bar graphs illustrating distributions of most likely copy numbers determined in CNVtools by fitting Gaussian mixture distributions to CNV measurements in the uncensored (a) Michigan samples, (b) Erlangen samples and (c) Nijmegen samples.
Basic properties of data sets from the different cohorts examined are given in Table S3, with results from association testing using uncensored data summarized in Table 1; a corresponding summary of association testing outcomes for censored data is given in Table S4. The uncensored Nijmegen discovery sample (Table 1) shows moderately strong association for the HSPD21, PRT mean, and triplex assays (OR = 1.313–1.386; p = 0.0087–0.0030), but is non-significant for the PRT107A assay (OR = 1.200, p = 0.11). This is a somewhat less significant association than reported in the original Hollox study (Hollox et al., 2008) for the Nijmegen cohort (p = 0.01–1.65 × 10⁻⁶ depending upon CNV assay), but a precise comparison is impossible since the CNV assays, sample inclusion, and methods of analysis all differ. However, re-analysis of the original Hollox study data (Barnes et al., 2008), using an early version of CNVtools, found significance of association (p = 0.002) of the same order of magnitude as this analysis of the retyped samples. Censoring the Nijmegen discovery sample lessens the significance but not the strength of the association, indicating a reduction in power caused by the reduction in sample size (Table S4).
Table 1.
Single cohort association tests (uncensored)
| linear trend model |
||||||||
|---|---|---|---|---|---|---|---|---|
| cohort | subset | assay | no. of cases/controls | OR | 95% CI | p-value | allelic model p-value | p-value for test of fit of allelic vs. linear trend model |
| Michigan | all | HSPD21 | 2616 / 2526 | 1.066 | 1.013–1.121 | 0.014 | 0.46 | 0.98 |
|
| ||||||||
| Erlangen | all | HSPD5 | 1696 / 910 | 1.085 | 1.007–1.169 | 0.033 | 0.45 | 0.90 |
| new | HSPD5 | 1396 / 621 | 1.039 | 0.953–1.133 | 0.38 | 0.86 | 0.87 | |
| old | HSPD5 | 300 / 289 | 1.214 | 1.031–1.428 | 0.020 | 0.21 | 0.79 | |
|
| ||||||||
| Nijmegen | all | HSPD21 | 187 / 238 | 1.343 | 1.093–1.649 | 0.0049 | 0.057 | 0.59 |
| PRT107A | 152 / 229 | 1.200 | 0.968–1.488 | 0.096 | 0.41 | 0.69 | ||
| PRT mean | 188 / 246 | 1.343 | 1.105–1.632 | 0.0031 | 0.036 | 0.53 | ||
| triplex | 188 / 246 | 1.288 | 1.063–1.560 | 0.0098 | 0.18 | 0.92 | ||
|
| ||||||||
| old | HSPD21 | 170 / 230 | 1.386 | 1.114–1.724 | 0.0034 | 0.087 | 0.91 | |
| PRT107A | 137 / 219 | 1.202 | 0.958–1.509 | 0.11 | 0.35 | 0.55 | ||
| PRT mean | 171 / 235 | 1.370 | 1.113–1.687 | 0.0030 | 0.053 | 0.71 | ||
| triplex | 171 / 235 | 1.313 | 1.071–1.610 | 0.0087 | 0.14 | 0.83 | ||
Association for the retyped and uncensored Erlangen cohort (Table 1: OR = 1.214, p = 0.02) is much weaker than first reported (p = 2.9 × 10⁻⁵–9.0 × 10⁻⁶), which reflects strong case-control bias, uncorrected in the original analysis, that artifactually inflated the association signal. In the current analysis of the Erlangen discovery sample, a case-control batch term was included when modeling both peak means and variances. The Barnes et al. re-analysis of the original Erlangen data set also found strong differential bias between cases and controls; after bias correction their analysis yielded a reduced association p-value of 0.02, identical to this analysis for the retyped data (Barnes et al., 2008). Censoring has little effect on the strength (odds ratio) or significance (p-value) of the association (Table S4).
The independent samples from Erlangen and Michigan (Table 1) are much larger than the original or retyped discovery samples, providing a powerful replication set for assessing the robustness of the original finding. The uncensored Erlangen replication sample shows a weak nonsignificant trend towards association (OR = 1.039, p = 0.38), and the uncensored Michigan sample shows a small but nominally significant association (OR = 1.066, p = 0.014). When an association study of a candidate locus is such that it has borderline or low power for finding genome-wide significance, yet it does indeed find genome-wide significance, this is usually due to the effect size (odds ratio) for the locus in that particular sample being, by chance, considerably larger than its true value in the underlying population. When this positive finding is followed up with a sample equal or larger in size to the original, the estimate of the odds ratio in the replication sample tends to be lower than in the first and closer to its true value, a phenomenon known as the “winner's curse” (Lohmueller et al., 2003). The weaker association in the replication samples compared to the retyped discovery samples is a good illustration of the winner's curse in action, and we assume that these estimated odds ratios are probably a better estimate of the true strength of association in people of European descent than those estimated from the discovery samples. As expected, adding 28 new individuals to the retyped Nijmegen sample had little impact on the association test results. The combined (new + old) Erlangen sample shows a modest association (OR = 1.085, p = 0.033) intermediate between the results obtained for the discovery and replication subsets (Table 1).
Table 2 presents the results of meta-analysis for association across cohorts for uncensored data, with the corresponding results for censored data shown in Table S5. Meta-analysis of the retyped discovery samples for the Nijmegen and Erlangen cohorts shows substantial association for uncensored data when using the HSPD21, mean PRT, or triplex assays for the Nijmegen sample (OR = 1.252–1.273, p = 5.5 × 10⁻⁴−2.5 × 10⁻⁴, Table 2). The combined discovery results are slightly weaker when using the PRT107A assay for the Nijmegen sample (OR = 1.210, p = 0.0047). The association for the non-PRT107A data for the combined retyped discovery samples is substantially less significant than reported in the supplement to the original Hollox et al. study (p = 3 × 10⁻⁸), but within an order of magnitude of what was found by the Barnes et al. CNVtools re-analysis of the original discovery typings (p = 6.5 × 10⁻⁵). This indicates that the reduction in significance in this analysis compared to the original report is probably mostly a consequence of bias correction in the Erlangen cohort, and not of other differences such as retyping, DNA re-extraction, new CNV assays, or slightly different sample composition.
Table 2.
Meta-analyses (uncensored)
| association (fixed effects) |
association (random effects) |
heterogeneity |
||||||
|---|---|---|---|---|---|---|---|---|
| stage | cohorts | no. cases/controls | meta-OR (95% CI) | meta-P | meta-OR (95% CI) | meta-P | Cochran's Q (p-value) | I2 (95% CI) |
| discovery | Erlangen (old) + Nijmegen (old, HSPD21) | 472 / 519 | 1.273 (1.117–1.450) | 3.0E-04 | 1.273 (1.117–1.450) | 3.0E-04 | 0.91 (0.34) | 0.0 (—) |
| Erlangen (old) + Nijmegen (old, PRT107A) | 440 / 508 | 1.210 (1.060–1.381) | 4.7E-03 | 1.210 (1.060–1.381) | 4.7E-03 | 0.004 (0.95) | 0.0 (—) | |
| Erlangen (old) + Nijmegen (old, mean PRT) | 473 / 524 | 1.271 (1.118–1.445) | 2.5E-04 | 1.271 (1.118–1.445) | 2.5E-04 | 0.81 (0.37) | 0.0 (—) | |
| Erlangen (old) + Nijmegen (old, triplex) | 473 / 524 | 1.252 (1.102–1.422) | 5.5E-04 | 1.252 (1.102–1.422) | 5.5E-04 | 0.35 (0.55) | 0.0 (—) | |
|
| ||||||||
| replication | Michigan + Erlangen (new) | 4014 / 3147 | 1.059 (1.014–1.106) | 1.0E-02 | 1.059 (1.014–1.106) | 1.0E-02 | 0.24 (0.62) | 0.0 (—) |
|
| ||||||||
| combined | Michigan + Erlangen (all) + Nijmegen (all, HSPD21) | 4502 / 3674 | 1.081 (1.038–1.127) | 1.9E-04 | 1.102 (1.021–1.189) | 1.3E-02 | 4.58 (0.10) | 56.3 (0.0–87.6) |
| Michigan + Erlangen (all) + Nijmegen (all, PRT107A) | 4468 / 3665 | 1.076 (1.033–1.121) | 4.7E-04 | 1.076 (1.033–1.121) | 4.7E-04 | 1.18 (0.56) | 0.0 (0.0–82.3) | |
| Michigan + Erlangen (all) + Nijmegen (all, mean PRT) | 4503 / 3682 | 1.083 (1.039–1.128) | 1.5E-04 | 1.107 (1.021–1.200) | 1.4E-02 | 5.15 (0.077) | 61.1 (0.0–88.9) | |
| Michigan + Erlangen (all) + Nijmegen (all, triplex) | 4503 / 3682 | 1.081 (1.037–1.126) | 2.0E-04 | 1.093 (1.025–1.165) | 6.6E-03 | 3.51 (0.17) | 43.0 (0.0–72.6) | |
Random and fixed effects meta-analyses of the two discovery samples give identical results, and there is no significant heterogeneity in the effect size (ORs) for the retyped Nijmegen and Erlangen cohorts (Cochran's Q = 0.004–0.91, p = 0.95–0.34; I2 = 0.0). Censoring the discovery samples resulted in somewhat weaker association (OR = 1.211–1.245, p = 0.0025–0.0073), presumably a consequence of the reduced sample size for the Dutch cohort (Table S5). Meta-analysis of uncensored data across all discovery and replication cohorts (Table 2) gives an OR of 1.076–1.083 (p = 4.7 × 10⁻⁴−1.5 × 10⁻⁴) under a fixed effects model. Meta-analysis of the two replication cohorts (Michigan and Erlangen) yields an association much weaker in strength and significance than the discovery cohort, for both the uncensored (Table 2: OR = 1.059, p = 0.010) and censored (Table S5: OR = 1.059, p = 0.012) data. There is no apparent heterogeneity. Hence the replication data are only weakly confirmatory of the original finding. Because of the winner's curse, the odds ratio of 1.059 for the association of the combined replication samples is a less biased estimate of the effect size in the underlying population than either the OR of the discovery or combined replication and discovery samples.
In this analysis, the increase in fit afforded by the allelic association model was never significantly better than the fit afforded by the linear model, so the results of the linear association model were chosen for simplicity and power. Under a linear model, any possible odds ratio between two copy number states can be computed from the single OR that is reported. Therefore the ORs for copy number classes differing by 2, 3, 4, or 5 copies would be estimated from our data as 1.121, 1.188, 1.258, and 1.332, respectively (i.e., 1.059 raised to the second, third, fourth, and fifth powers). Censoring has only a small effect on the meta-analysis of the combined discovery and replication sets (Table 2, Table S5).
Discussion
The new data presented in this report confirm the significant positive association found in the original cohorts from Nijmegen and Erlangen, and replicate this association at a nominally significant level in a newly typed cohort from Michigan (p = 0.014, Table 1) but not in new samples from Erlangen (p = 0.38). Meta-analysis (Table 2) combining more than 8000 discovery and replication samples suggests a significant but weak effect (p = 2 × 10⁻⁴, OR = 1.081), a much smaller effect size than the OR of 1.32 implied by the Hollox et al. data. This is certainly a weak level of association, less than the reported OR for any of the other 24 currently known psoriasis susceptibility loci with convincing associations (Capon et al., 2008; Cargill et al., 2007; de Cid et al., 2009; Ellinghaus et al., 2010; Genetic Analysis of Psoriasis Consortium et al., 2010; Hüffmeier et al., 2010; Nair et al., 2009; Stuart et al., 2010; Sun et al., 2010; Zhang et al., 2009), all of which have reported ORs of 1.10 or greater. However, these other associated loci are biallelic variations, and the highly variable β-defensin CNV commonly ranges from 2 to 7 total copies. Under a linear trend model, applying the OR of 1.059 given by the replication sample meta-analysis suggests that people with 7 copies of the β-defensin CNV have 1.332 times the odds of having psoriasis compared to people with 2 copies of the CNV, a substantial increase in risk. Association of this CNV with psoriasis may suggest the β-defensins as new targets for therapeutic intervention in controlling inflammation.
The combined sample size across all three collaborating groups is 8185 individuals (4503 cases and 3682 controls) for the uncensored data. This represents the most powerful sample to date for testing association of the β-defensin CNV and psoriasis, yet the p-value under a random effects meta-analysis is of only modest significance (p = 0.0066). Current standards for complex genetic diseases require candidate disease loci to reach genome-wide levels of significance of association before they are considered to be established as susceptibility loci. This is true even for studies of a single functional candidate such as this one. Because the a priori probability that any given locus in the human genome is truly associated with a complex disease is very low, the chance of a type I error is much higher than the nominal level of the test. For studies of SNP markers in people of European descent, the genome-wide level of significance has been determined to be a nominal p-value of approximately 5 × 10⁻⁸ (Dudbridge and Gusnanto, 2008). The overall p-value for β-defensin falls far short of this threshold. It is not clear, however, whether this threshold is too conservative for CNV testing.
There is no evidence from linkage or GWAS studies to support this association. However, such supporting evidence might not be expected, because there are no known SNPs that act as even approximate tags for beta-defensin copy number, and because copy number is a diploid aggregate (the sum of the two copy-number haplotypes), pedigree-based analysis has little power to implicate the locus (Hollox et al., 2008). It is therefore not clear what would constitute an appropriate significance threshold for this study, which involves typing a single, candidate CNV. If a number (of the order of a few thousand) reflecting the full genomic complement of known, distinct CNVs were used to correct for multiple testing, even that relatively modest correction would render these data non-significant overall.
Taken together, our results are consistent with a genuine but weak association between beta-defensin copy number and psoriasis, with the replication cohorts in this study giving a better estimate of the true effect size than the discovery study. Nevertheless, the p values here fall short of what is required to regard the evidence as definitively convincing. As association studies become increasingly powerful, they will increasingly deal with loci genuinely involved in the causation of phenotype, but which for large but finite sample sizes will not reliably reach genome-wide significance. In the instance of human stature, for example, very many heritable factors genuinely influence the phenotype, but many of these appear to have individual effect sizes too small to convincingly and reliably demonstrate in practice (Yang et al., 2010).
Materials and Methods
DNA Samples
Patients for this study were recruited from three countries. One collection comes from Nijmegen in the Netherlands, a second from Erlangen and Münster in Germany, and the third from Michigan in the United States. For shorthand, the German collection is referred to as simply the Erlangen sample, as this was the main organizing center, even though it includes people who were recruited at eight different centers. All individuals are of European descent; all sample collection followed appropriate Local Ethical Review and the Declaration of Helsinki principles, including informed written consent from all subjects.
Most of the Nijmegen sample (407 of 435 individuals) and about one-quarter of the Erlangen sample (590 of 2608 individuals) were included in a previous study of association between psoriasis and the β-defensin CNV (Hollox et al., 2008). These previously analyzed individuals have been retyped for both samples, with a newer assay in the case of the Nijmegen set. In addition, the Erlangen samples were re-purified before retyping. Since these samples led to the first report of association between β-defensin and psoriasis, they are considered the discovery sample, and this analysis constitutes a re-evaluation of the originally reported results, using retyped and re-purified samples and a more sophisticated method of data fitting and analysis. This re-evaluation is somewhat complicated by the fact that some individuals in the original Hollox study were not included in the retyped data set.
The newly acquired Nijmegen and Erlangen samples (28 and 2018 individuals, respectively), along with the Michigan sample (5142 individuals), can be considered an independent replication sample. Further clinical details can be found in the Supplemental Material, Section F. Because of the necessity to first analyze within each collection center cohort (see below), the new Nijmegen individuals are not used as part of the replication set in this analysis since they are too few in number to allow proper fitting of a Gaussian mixture model to the raw CNV data. For maximum power, this analysis also considers all discovery and replication samples combined (including the 28 new Nijmegen samples).
German psoriasis patients were recruited at eight different centers in Germany (four university hospitals, three psoriasis rehabilitation hospitals and one private practice) since 2002. DNAs derived from blood of cases and controls had been extracted by standard salting out procedure in 2002–2005 and were all purified in 2009/ 2010. DNA purification was performed with the QIAamp DNA Blood Mini kit (Qiagen, Hilden, Germany) according to the protocol, except for an elongated elution step of 5 minutes. Between October 2005 and July 2009, DNAs were automatically extracted with the Automatic Nucleic Acid Isolation System AutoGenFlex 3000 (Parallab, St. Albans, UK) using the FlexiGene DNA kit (Qiagen, Hilden, Germany). Since July 2009, DNAs were automatically extracted with Chemagic MSM I (Magnetic Separation Module I) using the Chemagic DNA Blood Kit (Chemagen, Baesweiler, Germany). All DNAs were stored at 4°C.
Michigan samples consisted of North American Caucasians collected across the United States with a higher density in the upper Midwest. Blood-derived DNA from psoriasis patients of any age and controls of at least 18 years of age was prepared by standard lysis method followed by phenol extraction and ethanol precipitation (Nair et al., 1995).
CNV assays and data processing
Four different typing assays were used to determine β-defensin copy number—three paralog ratio test (PRT) assays (HSPD5, HSPD21, PRT107A) and a newer triplex assay that combines the HSPD21 and PRT107A assays with an indel ratio test. None of these assays were used for all three sample sets. The Erlangen sample used the HSPD5 assay, which is the oldest method of the four (Armour et al., 2007). This assay co-amplifies a heat-shock protein pseudogene upstream of DEFB4 on chromosome 8 and a single-copy paralog on chromosome 5, yielding amplicons of 443bp and 447bp, respectively, which then need to be cleaved with HaeIII to allow their differentiation by electrophoresis. The Michigan sample used the newer HSPD21 assay (Aldhous et al., 2010), which co-amplifies the same heat-shock protein as the HSPD5 assay, together with a strictly diploid paralog on chromosome 21. Because the products of HSPD21 are 172bp and 180bp in size, restriction endonuclease digestion is no longer needed. The Nijmegen sample received the most comprehensive CNV typing, with two different PRT assays (HSPD21 and PRT107A) used both individually and together with a third indel ratio test to achieve a triplex assay (all described in (Aldhous et al., 2010)). Further details can be found in Supplementary Materials, section A.
Data quality, censoring and heterogeneity
In the Hollox et al. study (Hollox et al., 2008), a quality filter was imposed that censored out any individual whose ratios for the HEX- and FAM-labeled HSPD5 assay products differed by more than 15% of their mean. Because this filter can lead to bias (individuals with higher defensin copy number are more likely to be excluded, which can lead to differential missingness between cases and controls), the current data were analyzed both with and without censoring; further details are given in Supplementary Materials, section B.
CNV cluster fitting and association tests were carried out separately within each combination of analysis stage (discovery, replication, combined) and geographic cohort (Nijmegen, Erlangen, Michigan). Further details can be found in Supplementary Materials, sections D and E.
CNV data
Raw CNV estimates were analyzed for quality parameters (see Supplementary Materials, section C) and version 1.44.0 of CNVtools (Barnes et al., 2008) was used to model distributions as mixtures of Gaussian component distributions, presumed to correspond to the different integer copy number classes. These analyses demonstrated differential bias in both the discovery and replication samples from Erlangen, as evidenced by cases having larger means and variances than controls for the multiple peaks of the distribution of CNV estimates (Figure S2b). Because cases and controls were deliberately interspersed on each typing plate, this bias cannot be attributed to plate effects, but must be due to some property of the DNA preparations themselves. The particular sensitivity of CNV typing to such preparation-specific effects has been demonstrated in the WTCCC CNV study (Wellcome Trust Case Control Consortium, 2010) and in studies of CCL3L1 (Carpenter et al., 2011; Field et al., 2009).
Association testing
Formal testing of association was achieved by using CNVtools to simultaneously apply mixture model fitting and association testing to the raw copy number data (see Supplementary Materials, Section D). Association was tested under two disease models—a linear model where the effect on the log-odds of disease is proportional to the number of copies, and an allelic model where the odds of disease are allowed to vary freely among copy numbers. Because the optimal combination of parameters for fitting the mixture model was chosen without simultaneously testing for association (see previous section), to be conservative, for each cohort analysis the association testing was run for multiple parameter combinations.
Supplementary Material
Acknowledgements
We are grateful to all patients and control individuals for their participation in this study. We also thank Petra Badorf for her excellent technical assistance. This work was supported by the Interdisciplinary Centre for Clinical Research of the University of Erlangen-Nuremberg [IZKF B32/A8 to A.R. and J1 to U.H.], by the National Institutes of Health [R01AR042742, R01AR050511 to P.S., R.N., T.T., and J.T.E.], by the Ann Arbor Veterans Affairs Hospital, by the Dudley and Dawn Holmes Fund, and by the Babcock Memorial Trust. R.P. was supported by “Fundação para a Ciência e a Tecnologia” (FCT) (Foundation for Science and Technology) by a individual PhD scholarship with the reference SFRH / BD / 29753 / 2006, funded by the program POPH - QREN - Typology 4.1 – Advanced formation, co-participated by the European Social Fund and the Portuguese Ministry of Science, Technology and High Education.
Footnotes
Conflict of Interest The authors state no conflict of interest.
References
- Aldhous MC, Abu Bakar S, Prescott NJ, et al. Measurement methods and accuracy in copy number variation: failure to replicate associations of β-defensin copy number with Crohn's disease. Hum Mol Genet. 2010;19:4930–8. doi: 10.1093/hmg/ddq411. [DOI] [PMC free article] [PubMed] [Google Scholar]
- Armour JAL, Palla R, Zeeuwen PLJM, et al. Accurate, high-throughput typing of copy number variation using paralogue ratios from dispersed repeats. Nucleic Acids Res. 2007;35:e19. doi: 10.1093/nar/gkl1089. [DOI] [PMC free article] [PubMed] [Google Scholar]
- Barnes C, Plagnol V, Fitzgerald T, et al. A robust statistical method for case-control association testing with Copy Number Variation. Nat Genet. 2008;40:1245–52. doi: 10.1038/ng.206. [DOI] [PMC free article] [PubMed] [Google Scholar]
- Capon F, Bijlmakers M-J, Wolf N, et al. Identification of ZNF313/RNF114 as a novel psoriasis susceptibility gene. Hum Mol Genet. 2008;17:1938–45. doi: 10.1093/hmg/ddn091. [DOI] [PMC free article] [PubMed] [Google Scholar]
- Cargill M, Schrodi S, Chang M, et al. A large-scale genetic association study confirms IL12B and leads to the identification of IL23R as psoriasis risk genes. Am J Hum Genet. 2007;80:273–90. doi: 10.1086/511051. [DOI] [PMC free article] [PubMed] [Google Scholar]
- Carpenter D, Walker S, Prescott N, et al. Accuracy and differential bias in copy number measurement of CCL3L1 in association studies with three auto-immune disorders. BMC Genomics. 2011;12:418. doi: 10.1186/1471-2164-12-418. [DOI] [PMC free article] [PubMed] [Google Scholar]
- de Cid R, Riveira-Munoz E, Zeeuwen PLJM, et al. Deletion of the late cornified envelope LCE3B and LCE3C genes as a susceptibility factor for psoriasis. Nat Genet. 2009;41:211–5. doi: 10.1038/ng.313. [DOI] [PMC free article] [PubMed] [Google Scholar]
- Dudbridge F, Gusnanto A. Estimation of significance thresholds for genomewide association scans. Genet Epidemiol. 2008;32:227–34. doi: 10.1002/gepi.20297. [DOI] [PMC free article] [PubMed] [Google Scholar]
- Ellinghaus E, Ellinghaus D, Stuart P, et al. Genome-wide association study identifies a psoriasis susceptibility locus at TRAF3IP2. Nat Genet. 2010;42:991–5. doi: 10.1038/ng.689. [DOI] [PMC free article] [PubMed] [Google Scholar]
- Field SF, Howson JMM, Maier LM, et al. Experimental aspects of copy number variant assays at CCL3L1. Nature Medicine. 2009;15:1115–7. doi: 10.1038/nm1009-1115. [DOI] [PMC free article] [PubMed] [Google Scholar]
- Genetic Analysis of Psoriasis Consortium. The Wellcome Trust Case Control Consortium 2. Strange A, et al. A genome-wide association study identifies new psoriasis susceptibility loci and an interaction between HLA-C and ERAP1. Nat Genet. 2010;42:985–90. doi: 10.1038/ng.694. [DOI] [PMC free article] [PubMed] [Google Scholar]
- Groth M, Szafranski K, Taudien S, et al. High-resolution mapping of the 8p23.1 beta-defensin cluster reveals strictly concordant copy number variation of all genes. Hum Mutat. 2008;29:1247–54. doi: 10.1002/humu.20751. [DOI] [PubMed] [Google Scholar]
- Hollox EJ, Armour JAL, Barber JCK. Extensive normal copy number variation of a beta-defensin antimicrobial-gene cluster. Am J Hum Genet. 2003;73:591–600. doi: 10.1086/378157. [DOI] [PMC free article] [PubMed] [Google Scholar]
- Hollox EJ, Huffmeier U, Zeeuwen PLJM, et al. Psoriasis is associated with increased [beta]-defensin genomic copy number. Nat Genet. 2008;40:23–5. doi: 10.1038/ng.2007.48. [DOI] [PMC free article] [PubMed] [Google Scholar]
- Hüffmeier U, Uebe S, Ekici A, et al. Common variants at TRAF3IP2 are associated with susceptibility to psoriatic arthritis and psoriasis. Nat Genet. 2010;42:996–9. doi: 10.1038/ng.688. [DOI] [PMC free article] [PubMed] [Google Scholar]
- Linzmeier RM, Ganz T. Human defensin gene copy number polymorphisms: comprehensive analysis of independent variation in alpha- and beta-defensin regions at 8p22–p23. Genomics. 2005;86:423–30. doi: 10.1016/j.ygeno.2005.06.003. [DOI] [PubMed] [Google Scholar]
- Lohmueller KE, Pearce CL, Pike M, et al. Meta-analysis of genetic association studies supports a contribution of common variants to susceptibility to common disease. Nat Genet. 2003;33:177–82. doi: 10.1038/ng1071. [DOI] [PubMed] [Google Scholar]
- McCarroll SA. Copy-number analysis goes more than skin deep. Nat Genet. 2008;40:5–6. doi: 10.1038/ng0108-5. [DOI] [PubMed] [Google Scholar]
- Nair R, Duffin K, Helms C, et al. Genome-wide scan reveals association of psoriasis with IL-23 and NF-kappaB pathways. Nat Genet. 2009;41:199–204. doi: 10.1038/ng.311. [DOI] [PMC free article] [PubMed] [Google Scholar]
- Nair RP, Guo SW, Jenisch S, et al. Scanning chromosome 17 for psoriasis susceptibility: lack of evidence for a distal 17q locus. Hum Hered. 1995;45:219–30. doi: 10.1159/000154293. [DOI] [PubMed] [Google Scholar]
- Stuart P, Nair R, Ellinghaus E, et al. Genome-wide association analysis identifies three psoriasis susceptibility loci. Nat Genet. 2010;42:1000–4. doi: 10.1038/ng.693. [DOI] [PMC free article] [PubMed] [Google Scholar]
- Sun L, Cheng H, Wang Z, et al. Association analyses identify six new psoriasis susceptibility loci in the Chinese population. Nat Genet. 2010;42:1005–9. doi: 10.1038/ng.690. [DOI] [PMC free article] [PubMed] [Google Scholar]
- Wellcome Trust Case Control Consortium Genome-wide association study of CNVs in 16,000 cases of eight common diseases and 3,000 shared controls. Nature. 2010;464:713–20. doi: 10.1038/nature08979. [DOI] [PMC free article] [PubMed] [Google Scholar]
- Yang J, Benyamin B, McEvoy BP, et al. Common SNPs explain a large proportion of the heritability for human height. Nat Genet. 2010;42:565–9. doi: 10.1038/ng.608. [DOI] [PMC free article] [PubMed] [Google Scholar]
- Zhang X, Huang W, Yang S, et al. Psoriasis genome-wide association study identifies susceptibility variants within LCE gene cluster at 1q21. Nat Genet. 2009;41:205–10. doi: 10.1038/ng.310. [DOI] [PubMed] [Google Scholar]
Associated Data
This section collects any data citations, data availability statements, or supplementary materials included in this article.