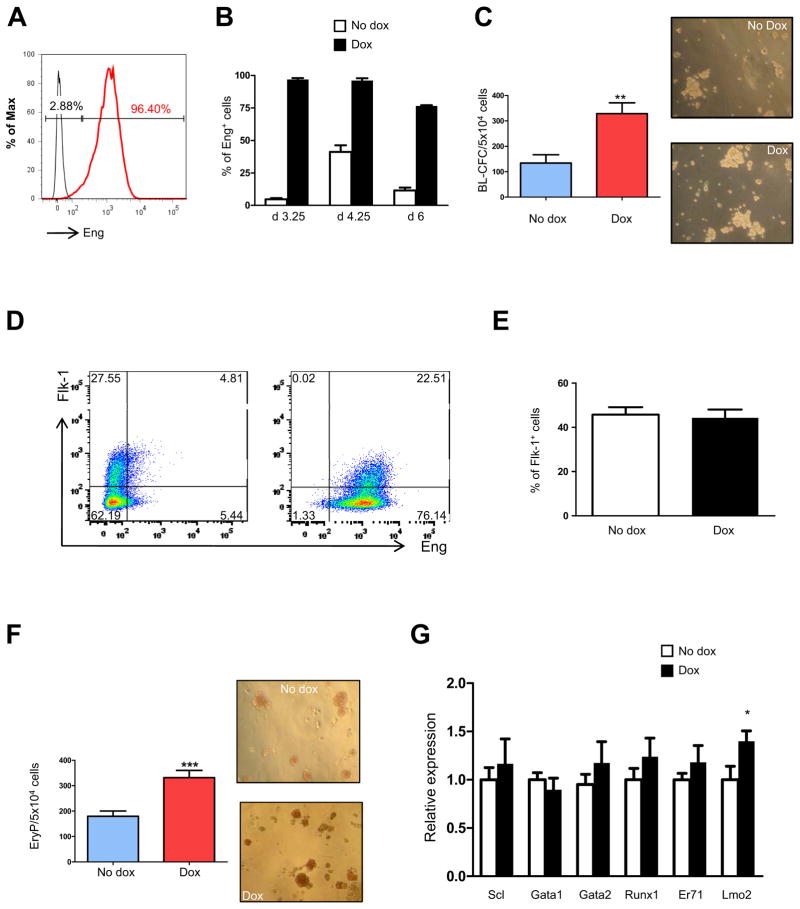
Fig. 1. Induction of endoglin stimulates hemangioblast and primitive hematopoietic development.
iEng ES cells were differentiated into EBs. Dox was added to the culture medium from day 2 of EB differentiation. (A) Histogram confirms substantial endoglin induction of day 3.25 iEng EBs following their treatment with dox for 30 hours. (B) Graph shows levels of endoglin expression in control non-induced, reflecting endogenous levels of Eng, and in dox-induced groups during EB development. (C) At the same time point, cells were assessed for hemangioblast activity in BL-MCM, which consists of methylcellulose containing VEGF, SCF, and TPO. Error bars indicate standard errors from 3 independent experiments performed in duplicate. *p<0.05. Right panels, representative morphology of blast colonies obtained from non-induced and induced iEng ES cells. Colonies are shown at the same magnification (100x). (D) A representative FACS profile for endoglin and Flk-1 expression at day 3.25, and (E) respective graphic representation on the frequency of Flk-1+ cells. Error bars indicate standard errors from 3 independent experiments. (F) Primitive erythroid colony activity of non-induced and Eng-induced day 4.25 EBs. Dox was added from day 2 of EB differentiation. Error bars indicate standard errors from 3 independent experiments performed in duplicate. Right panels show representative morphology of EryP colonies showed at the same magnification (100x). (G) Gene expression analysis for Scl, Gata1, Gata2, Runx1, ER71 (Etv2), and Lmo2. Transcripts are normalized to control non-dox group. Error bars indicate standard errors from 3 independent experiments performed in triplicate. *p<0.05.

