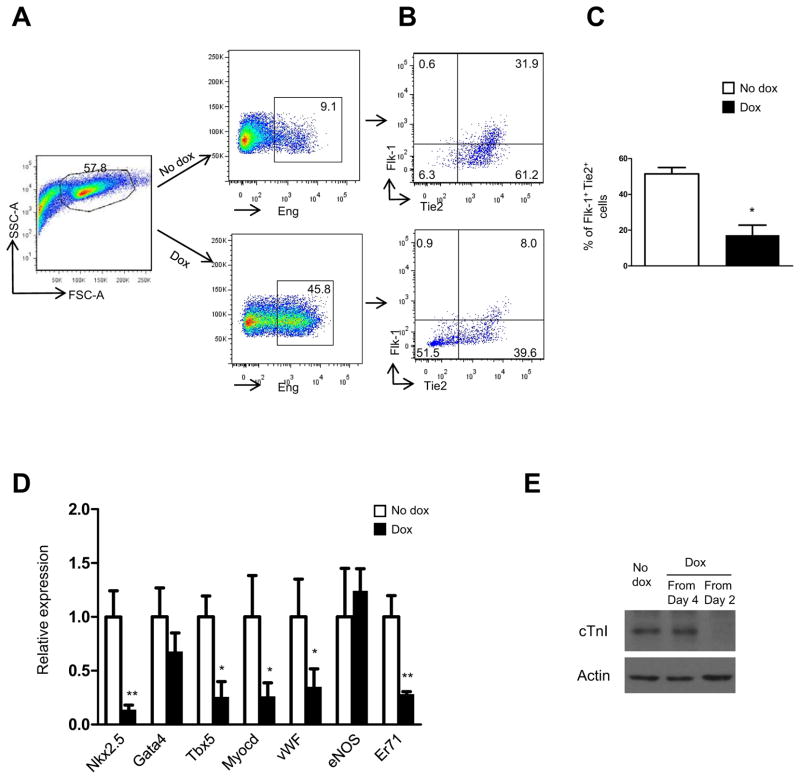
Fig. 3. Increased hematopoiesis happens at the expense of other mesodermal lineages.
(A) FACS plots show endoglin staining of non-induced (upper right) and Eng-induced (lower right) day 6 EBs (exposed to dox from day 2). Eng-expressing cells gated in (A) were then analyzed for the expression of (B) Flk-1 and Tie2, which together mark endothelial progenitors. Representative FACS plots demonstrate that endoglin induction inhibits the endothelial lineage (B). (C) Panel show respective graphic representation with the percentage of Flk-1+Tie2+ in non-induced and induced iEng ES cells. Error bars indicate standard errors from 3 independent experiments. *p<0.05 (E) Gene expression analysis for cardiac and endothelial markers, including Nkx2.5, Gata4, Tbx5, Myocardin (Myocd), vWF, eNOS, and Er71. Transcripts are normalized to control non-dox group. Error bars indicate standard errors from 2 independent experiments performed in triplicate. *p<0.05, **p<0.01. (F) Western blots for cTnI. Dox was added to EB medium from either day 4 or day 2 to day 9 of EB differentiation.

