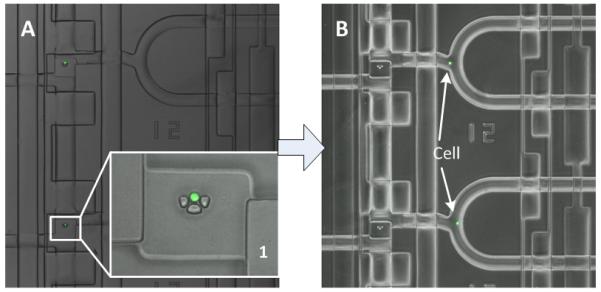
Fig. 3.

Microscope images of single cells captured in the microfluidic reaction chambers. (A) The cells were captured individually by the U-shape sieve structure in the cell loading area. Inset 1 shows the enlarged cell capture element, the single cell was stained with green fluorescent dye. (B) The captured single cells with green fluorescence were pushed from the cell trapping areas into different reaction chambers individually, followed by mixing with lysis buffer in the reactors.
