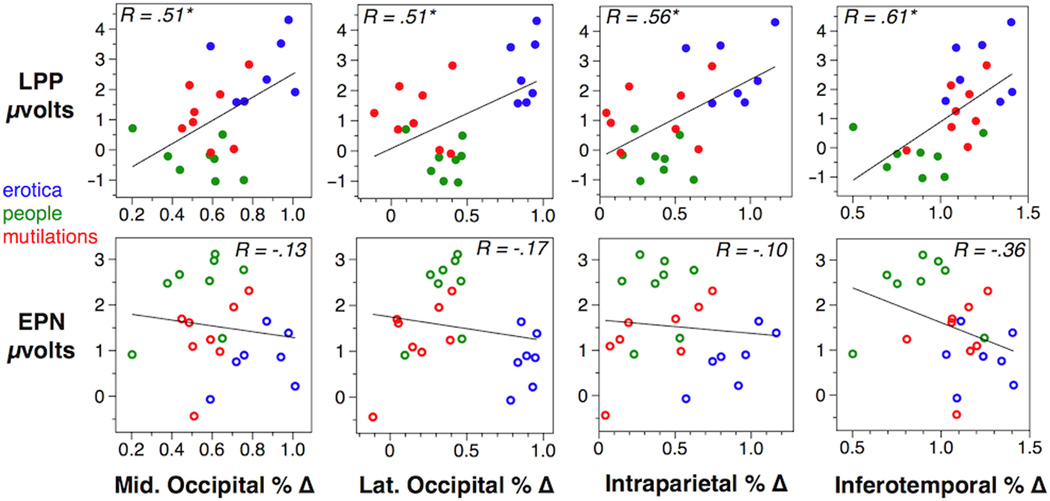
Figure 2.
Correlations are shown between LPP and EPN amplitude on the X axes, and BOLD signal change from 4 visual cortical ROIs on the Y axes. R values inset each plot indicate the linear relationship, values over .42 are significant at p < .05. Point colors represent erotic (blue) neutral people (green) and mutilation (red) picture exemplars.

