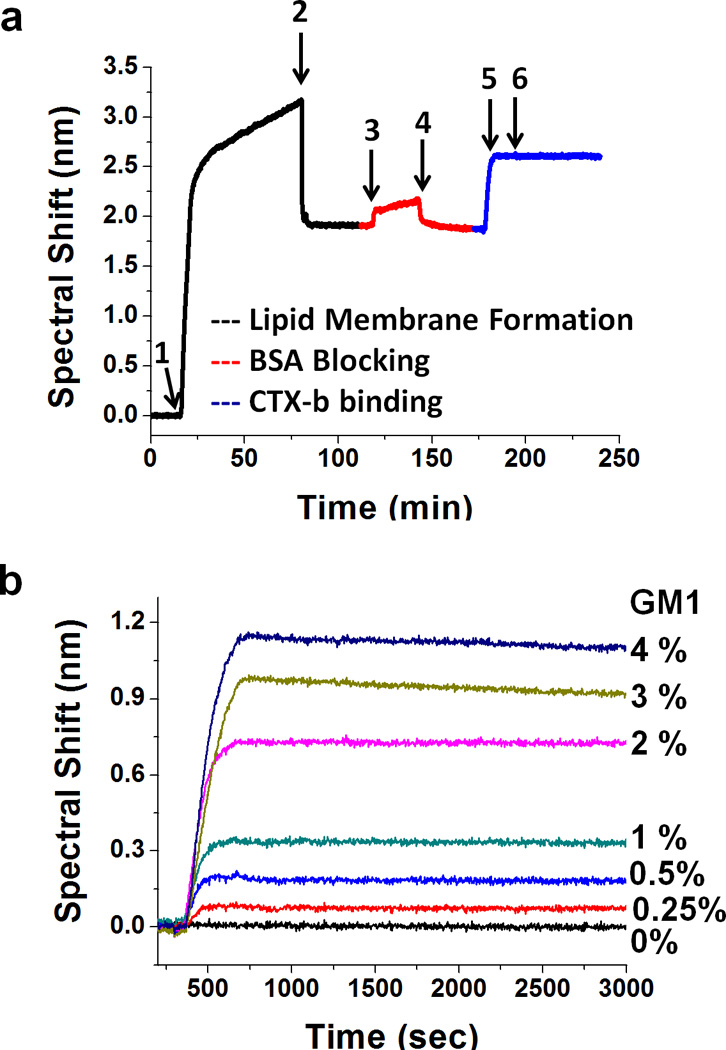
Fig_5.

(a) Sensorgram showing SLB formation, BSA blocking and CTX-b binding to GM1. 1) vesicle injection; 2) washing excess vesicles from surface; 3) BSA blocking; 4) wash excess BSA; 5) inject CTX-b; 6) end CTX-b injection and begin dissociation step by washing the channel with PBS. (b) Binding kinetics curves of 50 nM CTX-b with SLBs containing various concentration of GM1. The kinetic curves clearly show fast association and a slow dissociation of CTX-b binding to GM1. The maximum spectral shifts increase proportionally with the amount of GM1 receptor up to 2 mol % concentration.
