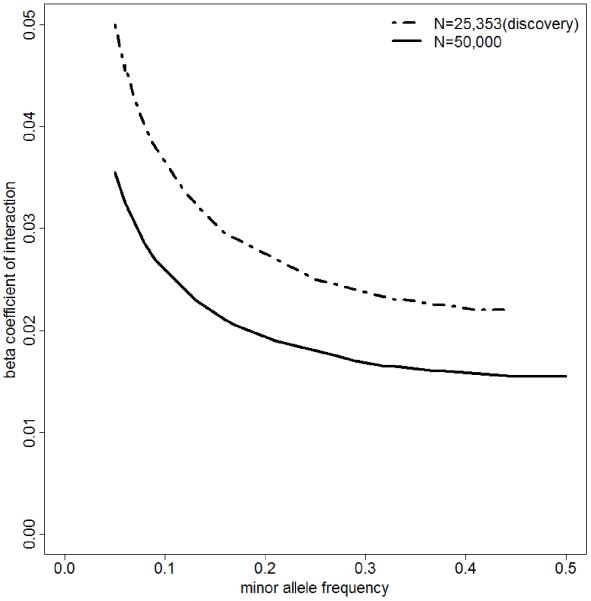
Figure 1. Power Analysis.
This plot presents the relationship between detectable gene-by-sex interaction effect size with 80% power and minor allele frequency. Specifically, we used the parameter estimates of rs1405534 in LSBMD (SD = 0.187 at genome-wide significant level of 5×10⁻⁸) along its relevant parameter estimates (effect size of −0.0048 for SNP and of −0.0219 for SEX), as the setting for our power analysis. The sample size used is 25,353 for discovery cohort and 50,000 (estimated) for discovery + replication cohort. With the sample of size 50,000, we would have 80% power to detect gene-by-sex interaction effect of 0.018 or larger in LSBMD for the SNP with minor allele frequency of 0.25. This would explain 0.08% variation of LSBMD. With 25,353 individuals in the Discovery stage, we did not have adequate power to identify interaction reaching genome-wide significant level (p < 5×10⁻⁸) at any allele frequency.

