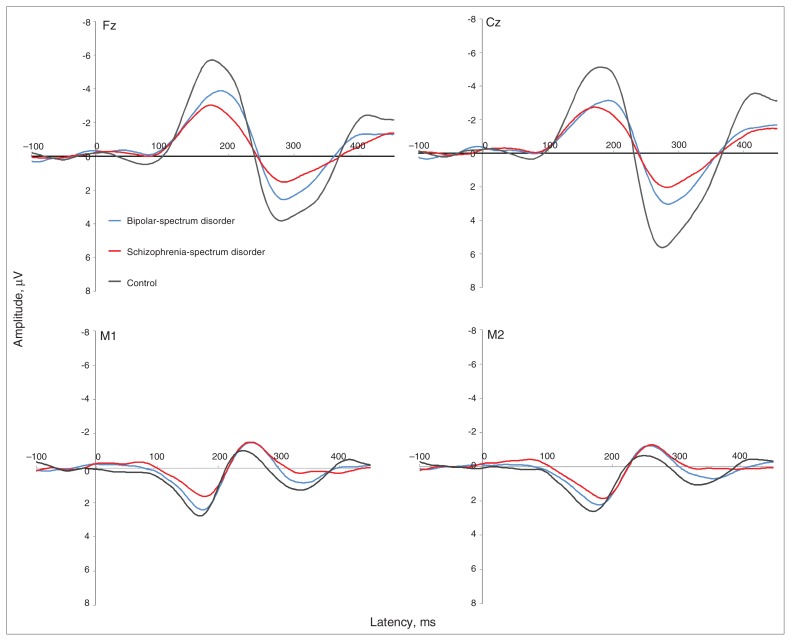
Fig. 2.
Grand average event-related potentials for early bipolar-spectrum disorder (dashed line), early schizophrenia-spectrum disorder (grey line) and control (black line) groups at (clockwise, from top left) frontal (Fz), central (Cz), right temporal (M2) and left temporal (M1) sites. The schizophrenia-spectrum disorder group showed reduced frontocentral (Fz, Cz) and temporal (M1, M2) mismatch negativity (MMN; 135–205 ms) and frontocentral (Fz, Cz) P3a (250–300 ms) amplitudes (μV) at frontocentral sites (Fz, Cz) compared with controls. The bipolar-spectrum disorder group showed reduced frontocentral (Fz, Cz) MMN (135–205 ms) and central (Cz) P3a (250–300 ms) amplitudes (μV) compared with controls. Note that M1 and M2 waveforms are reversed in polarity owing to the nose-referenced recording.

