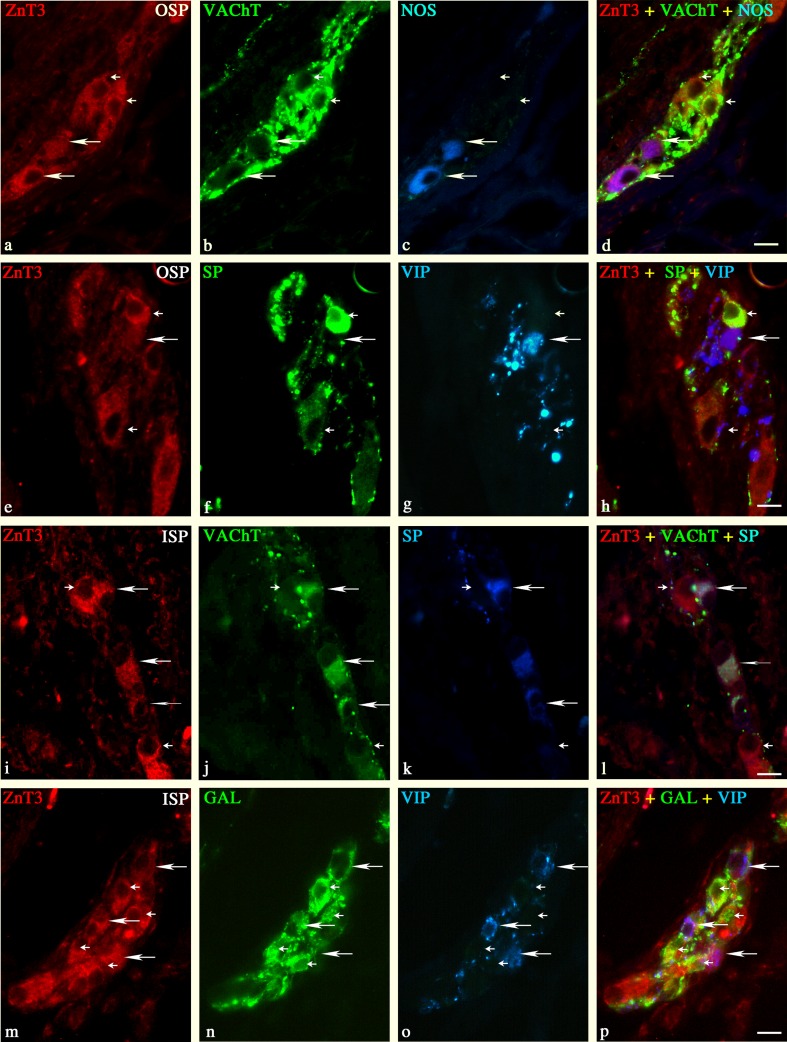
Fig. 3.
Representative images of ZnT3+ neurons located in the duodenal OSP (a–h) and ISP (i–p) of the pig. Merged images (d, h, l, p) are composites of images taken separately from red (a, c, i, m), green (b, f, j, n), and blue (c, g, k, o) fluorescent channels. Scale bar = 25 μm. a–d ZnT3+/VAChT−/NOS+—long arrows, ZnT3+/VAChT+/NOS−—small arrows; e–h ZnT3+/SP−/VIP+—long arrow, ZnT3+/SP+/VIP−—small arrows; i–l ZnT3+/VAChT+/SP+—long arrows, ZnT3+/VAChT+/SP−—small arrows; m–p ZnT3+/GAL+/VIP−—long arrows, ZnT3+/GAL−/VIP+—small arrows

