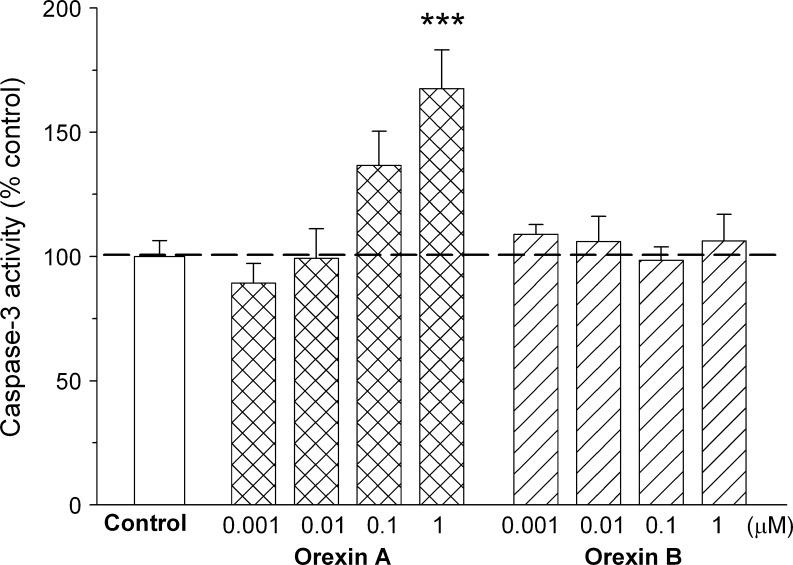
Fig. 4.
Effects of orexin A and orexin B on basal caspase-3 activity in rat C6 glioma cells. The cells were incubated with the peptides (0.001–1 μM) for 24 h. The results are expressed as a percent of the respective control values and represent means ± SEM of five to 13 values per group. Three asterisks indicate P < 0.001 versus control

