
Figure 2. Intracellular calcium ( ) responses of aortic body (AB) and carotid body (CB) type I cells to chemostimuli.
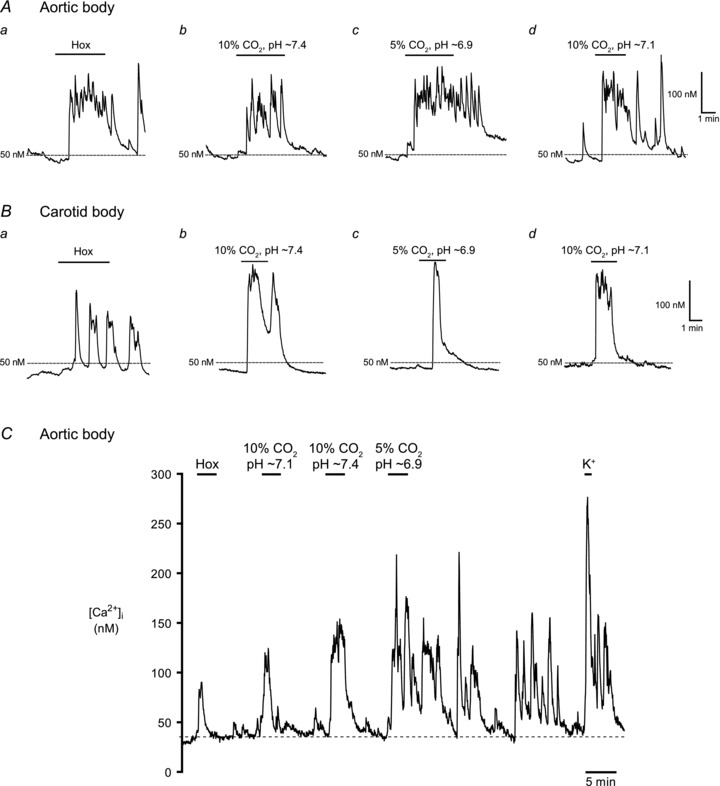
Example Ca2+ traces from responsive AB type I cells (A) and CB type I cells (B), to hypoxia (Hox;  ∼25 mmHg), isohydric hypercapnia (10% CO2, pH 7.4), isocapnic acidosis (5% CO2, pH ∼6.9; H+) and acidic hypercapnia (10% CO2, pH ∼7.1). In C, a complete
  trace from an AB type I cell within a triplet shows responses to all 4 chemostimuli and the depolarizing stimulus, high (30 mm) K+. Isocapnic acidosis (H+) elicited the largest responses regardless of stimulus order, but was usually applied last because there was continuous Ca2+ activity even after washout.