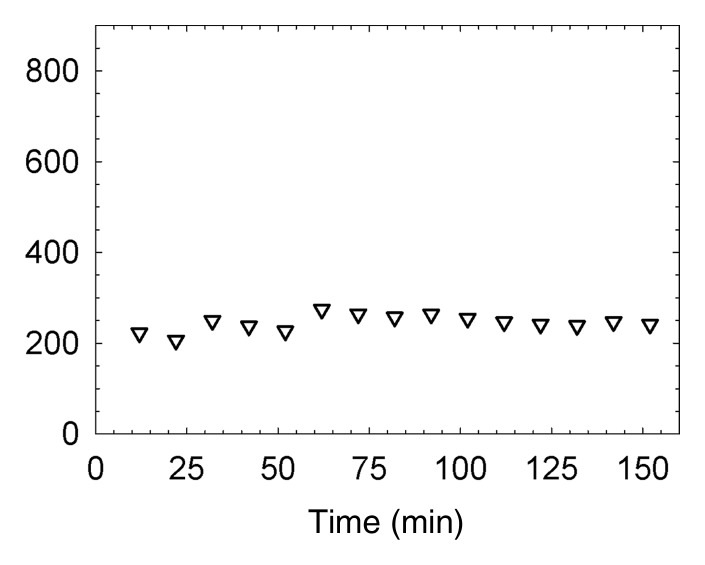
Figure 3d:
(a, c) Examples of fluorescence imaging of mouse SLNs (arrows) within ROIs (white outlines). kcts = Kilocounts. (a) Optical image obtained 150 minutes after administration of a 0.11-nmol dose of Cy7 tilmanocept yielded an SLN with an integrated fluorescence intensity with an ROI of 780 × 103 counts. The pixel with the highest fluorescence intensity held 64 × 103 counts. (b) Time-intensity curve from the SLN shows sustained accumulation from 140 × 103 counts at 15 minutes to 800 × 103 counts at 100 minutes. SLN uptake rate constant, percentage of injected dose, and SLN extraction were 1.65 hours−1, 0.53%, and 89%, respectively. (c) Optical image (150 minutes) of the injection site and popliteal lymph node in a mouse in the high-dose group (31 nmol) shows decreased sentinel node intensity. (d) Time-intensity curve from the SLN showed diminished uptake due to receptor saturation. SLN accumulation rate, percentage of injected dose, and SLN extraction were 0.029 hour−1, 0.28%, and 19%, respectively.

