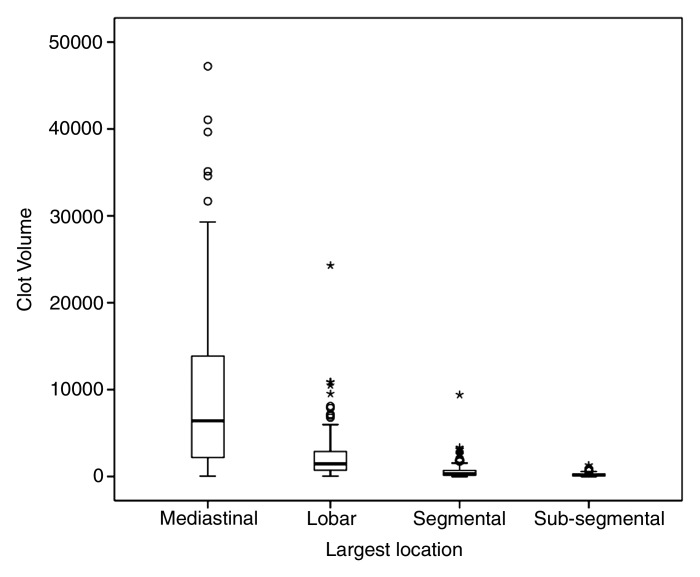
Figure 2:
Box-and-whisker plot shows distribution of clot volume according to the proximal extension of the clot (largest pulmonary artery affected): mediastinal (mean, 9546.3 mm3 ± 699.6; median, 6419.1 mm3), lobar (mean, 2391.8 mm3 ± 234.3; median, 1454.9 mm3), segmental (mean, 613.6 mm3 ± 64.2; median, 314.4 mm3), and subsegmental (mean, 223.8 mm3 ± 23.5; median, 152.1 mm3). Mediastinal = main pulmonary trunk, right and left interlobar arteries.

