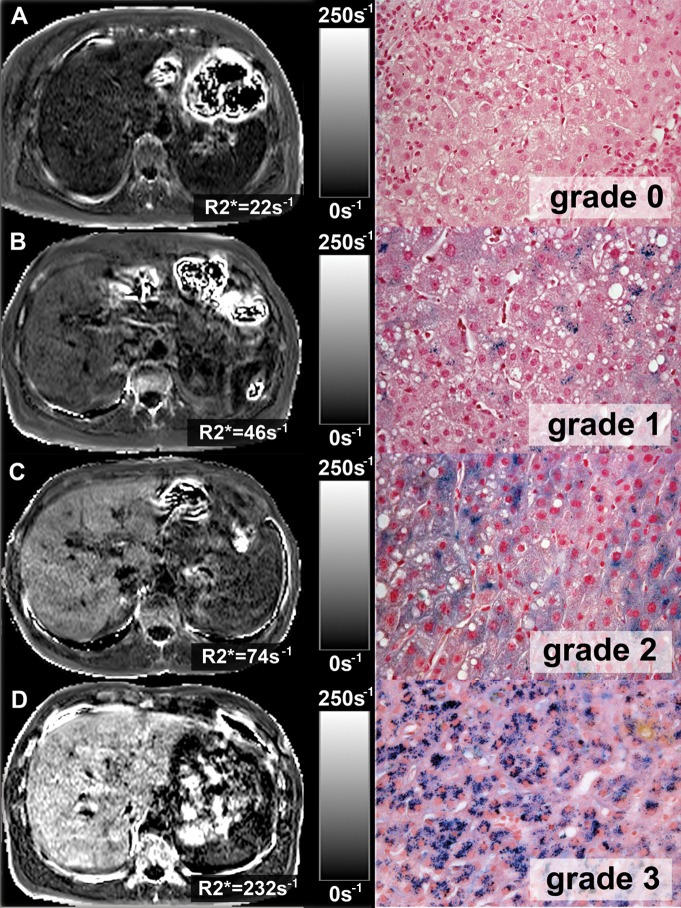
Figure 3:
R2* maps (left) estimated by using multipeak modeling of fat in four patients with different grades of liver iron overload and corresponding images at histologic examination (right) obtained by using Perl’s Prussian blue stain (magnification, ×400). Excellent correlation between R2* values and histologic iron grades was observed.

