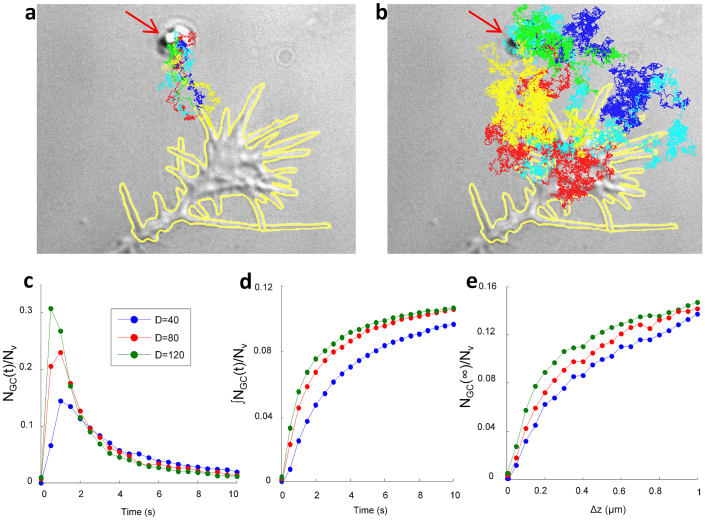
Figure 5. Estimation of the fraction of released guidance molecules reaching the GC membrane (NGC / Nv).
(a) Examples of fast trajectories reaching the GC membrane in less than 1 s after VB. (b) Slower trajectories reaching the GC in 1–10 s after VB. Trajectories were obtained solving the stochastic equation numerically (1) with initial conditions Lv = (0,0,a). The GC profile is shown by the yellow curve. Different trajectories are shown with different colors and the vesicle encapsulating guidance molecules is indicated with the red arrow. (c) Distributions of arrival times on the GC membrane of trajectories starting from Lv for three different diffusion coefficients spanning the considered range. (d) Time integral of the distributions shown in c. (e) The ratio NGC / Nvbetween the total number of molecules inside the vesicle Nv and those reaching the GC membrane NGC as a function of GC height Δz. These simulations suggest that about 10% of molecules in the vesicle reach the GC membrane within 10 s after VB and NGC/Nv was taken to be 0.1±0.04.

