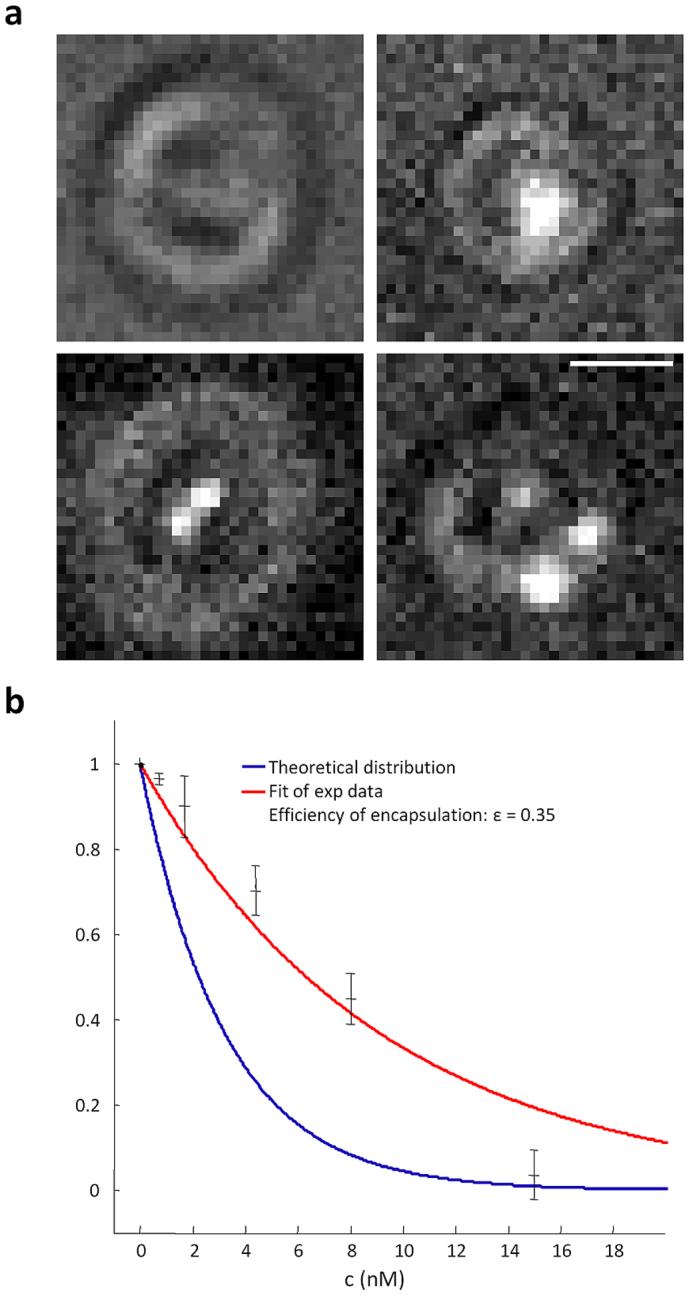
Figure 7. Quantification of the encapsulation efficiency by QDs analysis.

(a) Simultaneous brightfield/fluorescence images of lipid vesicles encapsulating QDs. Due to the diffraction limit on resolution we could not determine the exact number of encapsulated QDs, but we could determine whether a vesicle had QDs inside or not. Therefore we measured the fraction of empty vesicles at different concentrations. (b) Measurement of the fraction of empty vesicles over the total amount of vesicles of 1μm diameter as function of the concentration of QDs. The blue line indicates the theoretical distribution of empty vesicles, while the red line indicates the exponential fit of experimental data giving a value of ε = 0.35. Scale bar: 1 µm.
