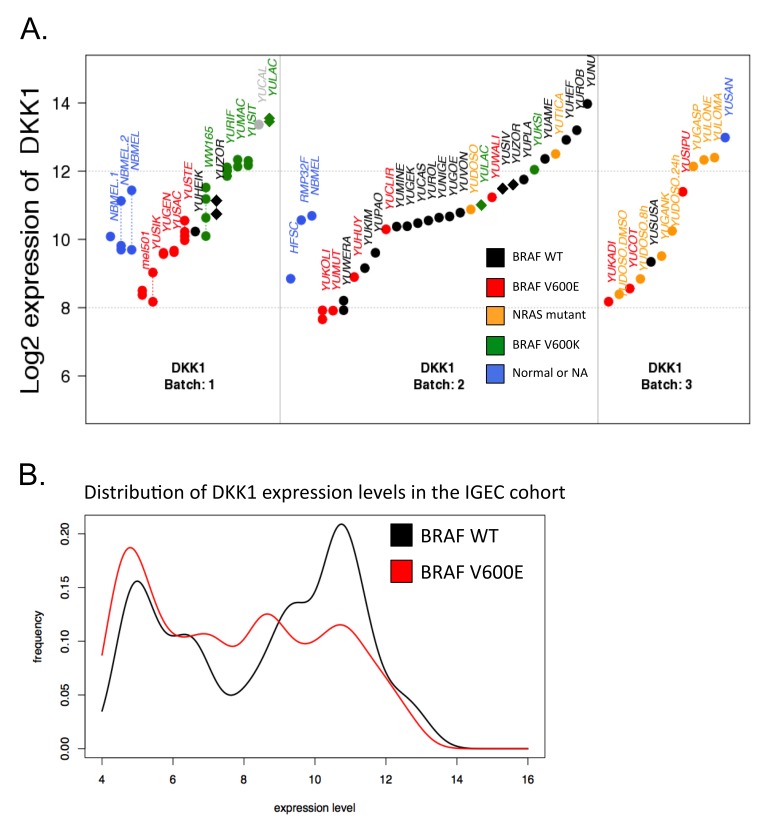
Figure 7.
DKK1 gene expression levels are associated with BRAFV600 mutation status. A. Expression levels of DKK1 gene in the YSM cohort. Samples have been divided into batches based on gene expression profiling. Replicates are shown when available and are connected by a dashed line. Each sample has been characterized for BRAF and NRAS mutations. With few exceptions, BRAFV600E samples show an expression level below 11 for the DKK1 gene. B. Distribution of DKK1 expression levels in the independent IGEC cohort. The samples in the cohort were divided according to their BRAF mutation status: WT (black) and V600E (red). As expected, WT exhibits clear bi-modality, the lower mode corresponding to the mode of the distribution of DKK1 expression levels in the BRAFV600E group.

