
Figure 4.
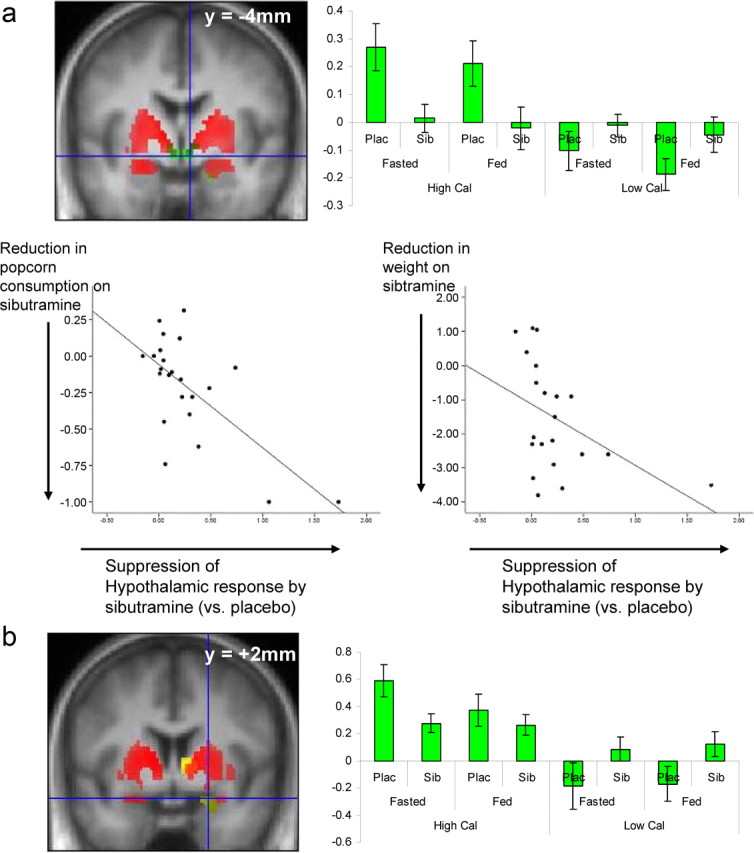
a, Hypothalamic responses to experimental manipulations (image type and sibutramine status). Top left, A coronal section of the group average structural MRI at 4 mm posterior to the anterior commissure. Superimposed in red are the local regions showing a calorie-specific (high-calorie vs low-calorie images) effect (p < 0.05, corrected), and in green (p < 0.01, uncorrected) are the hypothalamic regions in which this calorie-specific response is significantly attenuated by sibutramine. Top right, The plots show estimates of stimulus-related brain activation for each of the eight key conditions, divided by image type (high calorie/low calorie), satiety state (fasted/fed), and treatment (sibutramine/placebo). The y-axes show the effect sizes in the ventral striatal region shown or parameter estimates derived from the general linear model (units are arbitrary). As can be seen there is a strong effect of image type and of sibutramine but not of fasted/fed state. Bottom, Scatter plots showing the associations between the effect of sibutramine on suppression of hypothalamic activation by high-calorie food images (x-axis) and its effects on the proportion of ad libitum popcorn consumed on sibutramine compared to placebo (left) and on body weight in kilograms (right). In both graphs, a value of greater than zero on the x-axis indicates a suppression of activation on sibutramine compared to placebo; a value of less than zero on the y-axis indicates that there was a greater reduction in snacking or weight for sibutramine compared with for placebo. The graphs show that participants who demonstrated greater suppression of hypothalamic activation by sibutramine also showed greater treatment-related reduction in popcorn snacking and body weight. b, Amygdala responses to experimental manipulations (image type and sibutramine status). Left, A coronal section of the group average structural MRI at 2 mm anterior to the anterior commissure. Superimposed in red are the local regions showing a calorie-specific (high-calorie vs low-calorie images) response (p < 0.05, corrected), and in green (at crosshairs) is the amygdala region in which this calorie-specific response is significantly attenuated by sibutramine (p < 0.01, uncorrected). Right, The plots show estimates of stimulus-related brain activation for each of the eight key conditions, divided by image type (high calorie/low calorie), satiety state (fasted/fed), and treatment (sibutramine/placebo). The y-axis show the effect sizes in the ventral striatal region shown or parameter estimates derived from the general linear model (units are arbitrary). As can be seen, there is a strong effect of image type and of sibutramine but not of fasted/fed state.