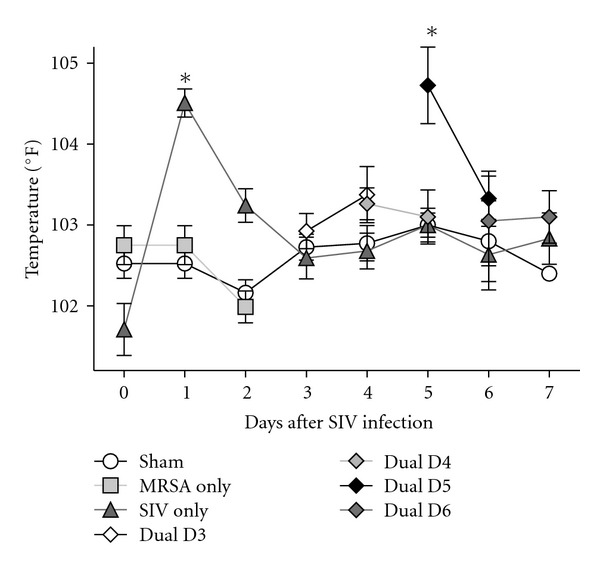
Figure 1.

Rectal temperature during SIV and MRSA infection. Twenty-eight animals were intranasally infected on day (D) 0 with SIV 1145 (SIV only), four animals were infected with MRSA (MRSA only), and six were sham-infected with PBS (Sham). On the morning of days 3 (Dual D3), 4 (Dual D4), 5 (Dual D5), or 6 (Dual D6) following SIV infection, groups of four animals were inoculated with MRSA. Days after SIV infection are indicated on the X-axis, and evening body temperature is plotted on the Y-axis. Asterisk indicates a P value of <0.05 for the marked data point compared with temperature on D0. Values represent mean with standard error.
