
Figure 10.
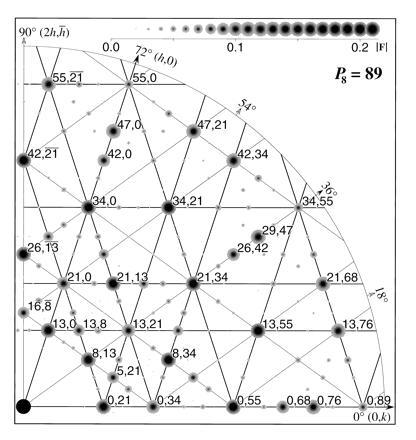
Indexing of the P8 = 89 diffraction pattern. The quadrant in Fig. 7 is enlarged and the most intense spots are labeled with their h,k indices. The thick lines, which are parallel to the crystal axes and are spaced at intervals of consecutive Fibonacci numbers, pass through rows of lattice points including the most intense spots. The thin lines, at angles of ± 36° to the (0,k) direction, are noncrystallographic but nearly pass through centers of the intense spots related by the noncrystallographic 10-fold symmetry.