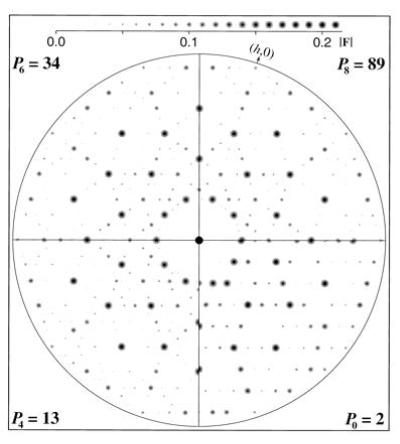
Figure 7.

Diffraction patterns of regular pentilings. Model electron density maps similar to Fig. 2 were calculated by placing identical atoms with temperature factors of 5 Å2 at the vertices and centers of pentagons in the P0 = 2, P4 = 13, P6 = 34, and P8 = 89 pentilings from Figs. 1a, 4a, 3b, and 4b, respectively. The pentagon edge length E in this construction is 4.7 Å. Fast Fourier transforms of these maps were calculated to 0.9-Å resolution and the amplitudes were scaled by setting F00 to unity. The maximum scaled amplitude in each pattern is |Fmax| ≈0.2. The quadrants, which include all independent Fourier coefficients for each pattern, are aligned with the (0,k) axis horizontal. The patterns from the higher order pentilings have evident 10-fold symmetry. Comparison across the boundary between the P6 = 34 and P8 = 89 patterns demonstrates that they are virtually indistinguishable. The structure factors, which are discrete points in reciprocal space, are depicted as Gaussian disks with radii proportional to the amplitudes as indicated in the |F| scale at the top. The intensity range displayed is ≈100.
