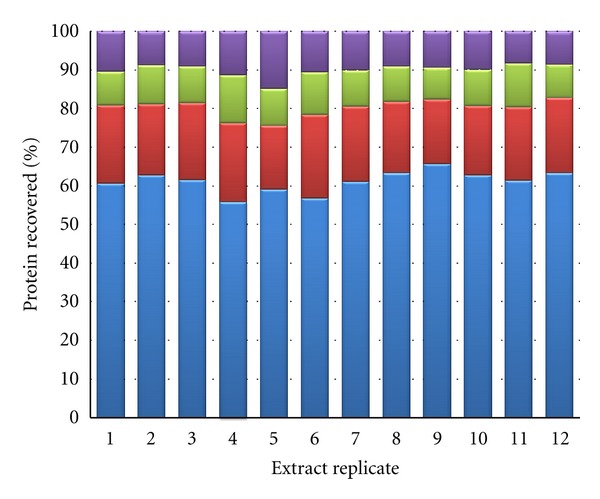
Figure 1.

The distribution of extracted proteins in subcellular proteome fractions from twelve samples of cultured human Neuro-2A cells using the described DDF protocol (cellular phenotypes randomised and denoted replicates 1–12). Proteins were quantitated using a BCA method and quantities were normalised as a percentage of total extracted protein. Fractions denoted are cytosolic (blue), membrane/organelle (red), nuclear (green), and cytoskeletal (violet).
