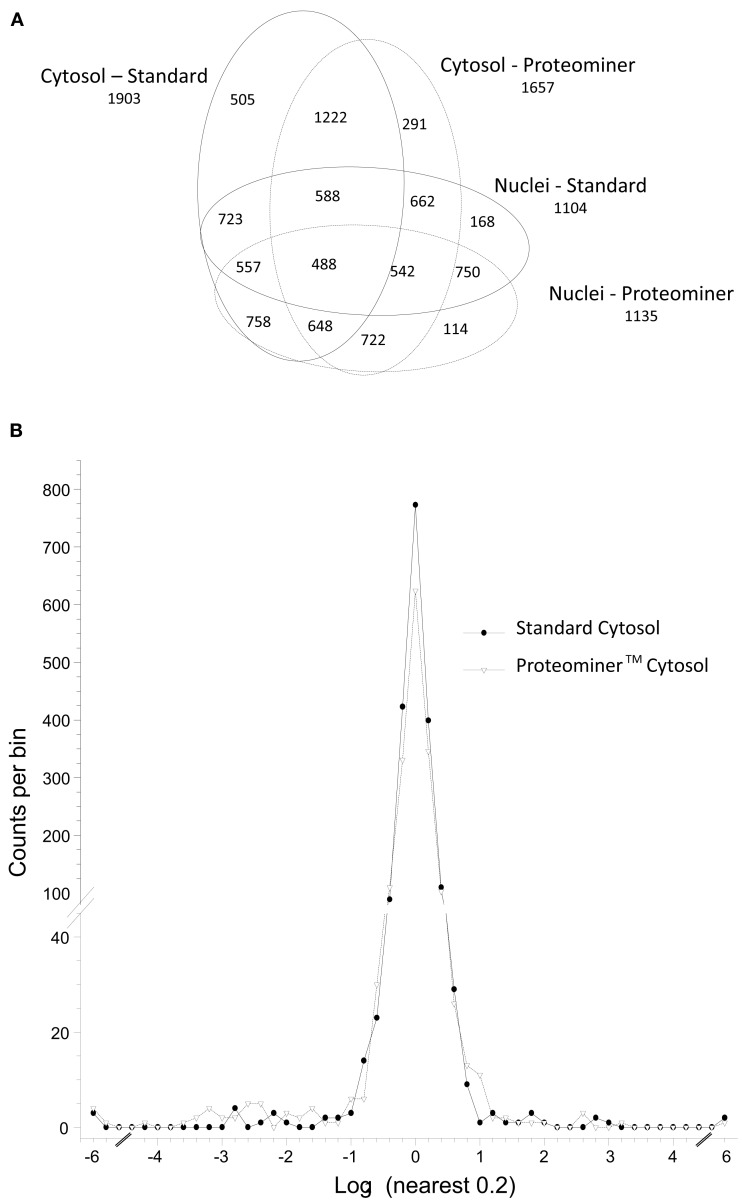
Figure 3.
Distributions of proteins identified in various experiments. (A) Venn diagram of numbers of identified proteins from various analyses. (B) Frequency distributions of identified proteins in two virus-infected sample sets, with H:L ratios expressed as log2 values. Positive values represent up-regulated host proteins in virus-infected cells; negative values represent down-regulated host proteins. Characteristics of all peptide and protein distributions, mean log2 H:L ratios, and SDs of log2 H:L ratios are shown in Table 1.

