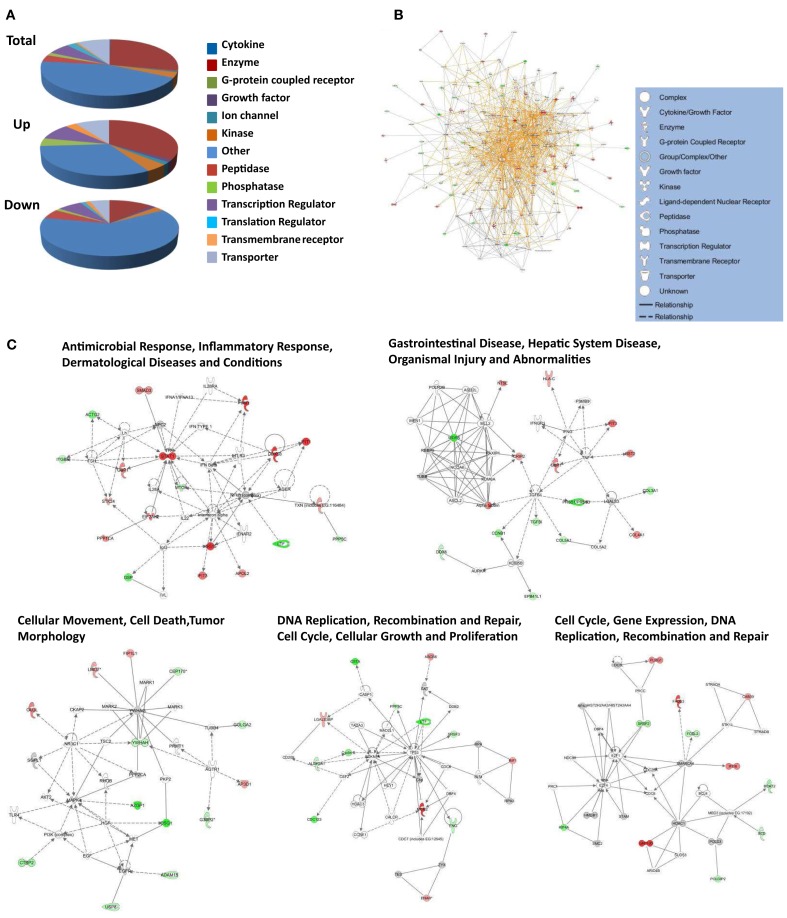
Figure 6.
Molecular pathways of regulated proteins. Proteins and their levels of regulation were imported into the Ingenuity Pathways Analysis (IPA®) tool and interacting pathways were constructed. (A) Ontological classifications of all measured proteins (Total) as well as those significantly up- and down-regulated. The indicated ontological classifications start at the top of each pie chart and are presented clockwise. (B) Merged networks, containing all molecules present in each of the five individual networks. (C) The top five networks, identified at 95% confidence and each of which contained 11 or more “focus” molecules (molecules significantly up- or down-regulated), with pathway names indicated. Solid lines: direct known interactions; dashed lines: suspected or indirect interactions; red: significantly up-regulated proteins; pink: moderately up-regulated proteins; gray: proteins identified but not significantly regulated; light green: moderately down-regulated proteins; dark green: significantly down-regulated proteins; white: proteins known to be in network, but not identified in our study.

