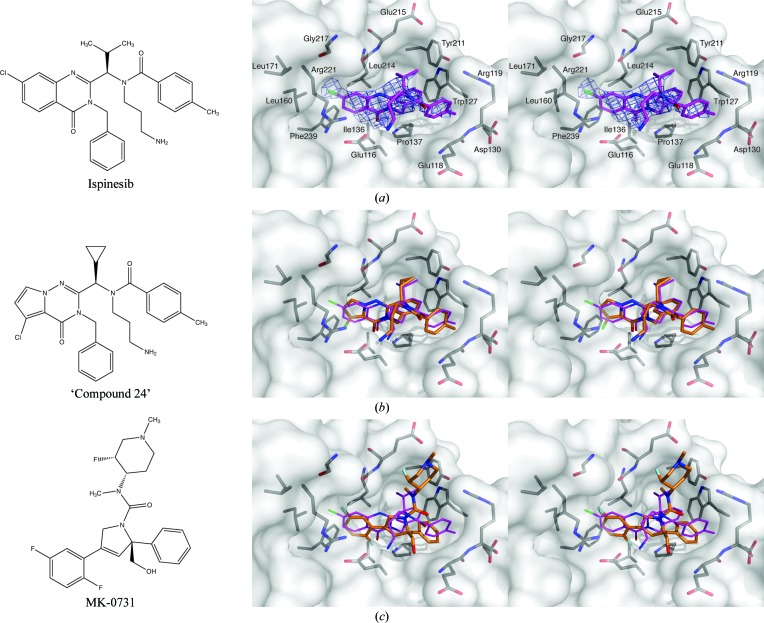
Figure 4.
Interactions of ispinesib with the Eg5 inhibitor-binding region and comparison with other inhibitors of Eg5. (a) Chemical structure of ispinesib (left); stereoview of ispinesib (purple sticks) bound to the allosteric site of Eg5. Side chains and/or backbone atoms of interacting protein residues are shown as grey sticks and labelled; the protein surface is displayed semitransparently. Unbiased (i.e. calculated prior to including the ligand in the model) σA-weighted F o − F c electron density for the ligand contoured at 2.5σ is shown in slate. (b) Chemical structure (left) and comparison of the Eg5 binding mode (right) of ‘compound 24’ (orange). (c) Chemical structure (left) and comparison of the Eg5 binding mode (right) of MK-0731 (orange).

