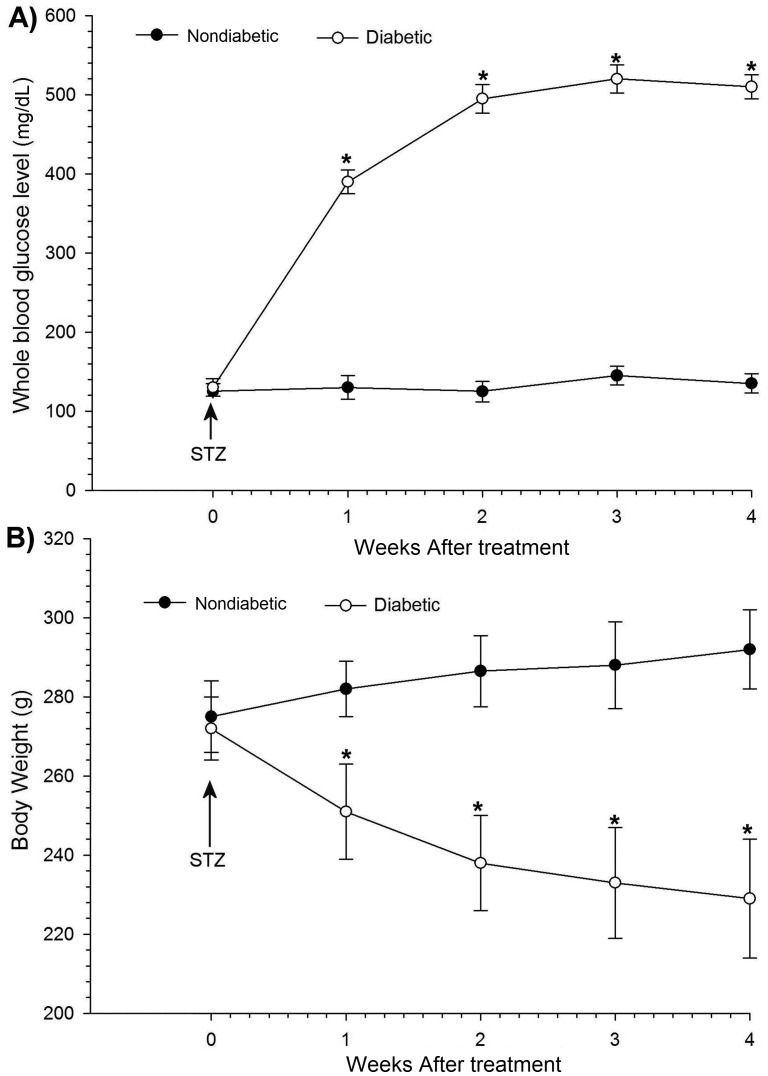
Figure 1.
General metabolic indicators of saline-treated (nondiabetic) and STZ-treated rats. (A) Blood glucose levels were elevated after treatment with STZ compared with those in nondiabetic rats. (B) STZ induction caused significant decreases in body weight. Each point represents the mean value of 7 rats, and the vertical bars indicate 1 SD. *, Significant (P < 0.05; repeated-measures ANOVA and the posthoc Dunn test) differences between diabetic and nondiabetic groups.

