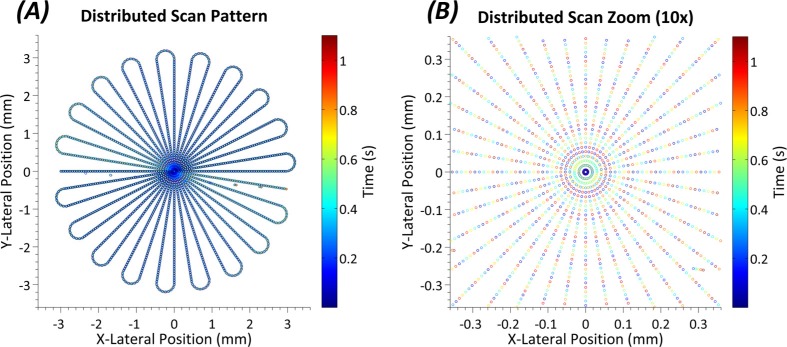
Fig. 2.
(A) Distributed scan SDOCT pattern used in the study. Each point on the plot is in the correct lateral spatial location while the color of each point indicates the time at which it was taken. (B) A 10x zoom of the central region of the scan. Here the individual points can be distinguished. Note the distinctly different times at which spatially adjacent points are taken.

