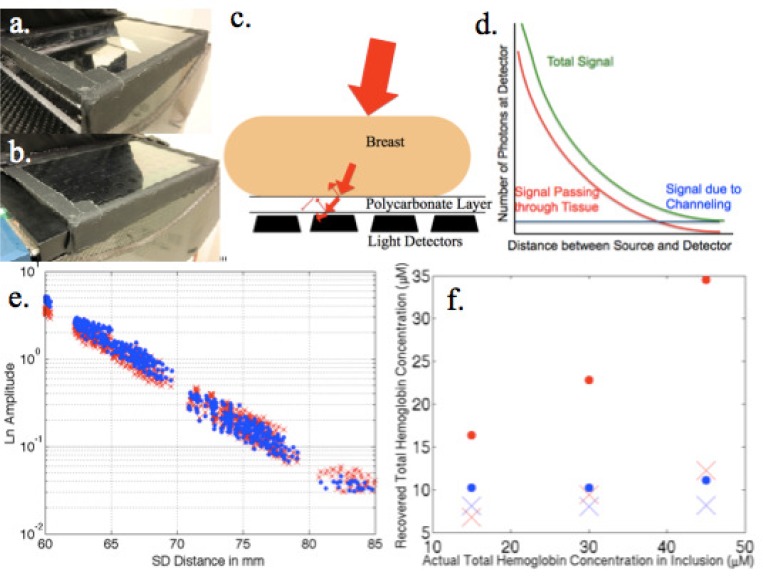
Fig. 3.
(a) Photograph of the detector case developed for the combined NIRST/DBT system. (b) Same as (a) with the detector panel inserted. (c) Depiction of light channeling in the detector case. (d) Graph illustrating the effects of light channeling on the acquired NIRST data. (e) Raw 660 nm data acquired from a homogeneous resin phantom when placed directly on top of the detectors (in blue) relative to when imaged with the detector enclosed in the case (red). (f) Agar inclusion phantoms with increasing hemoglobin contrast (background in blue, inclusion in red) when imaged on a thin plastic film above the detectors (dots) and when imaged on the detector case (×).

