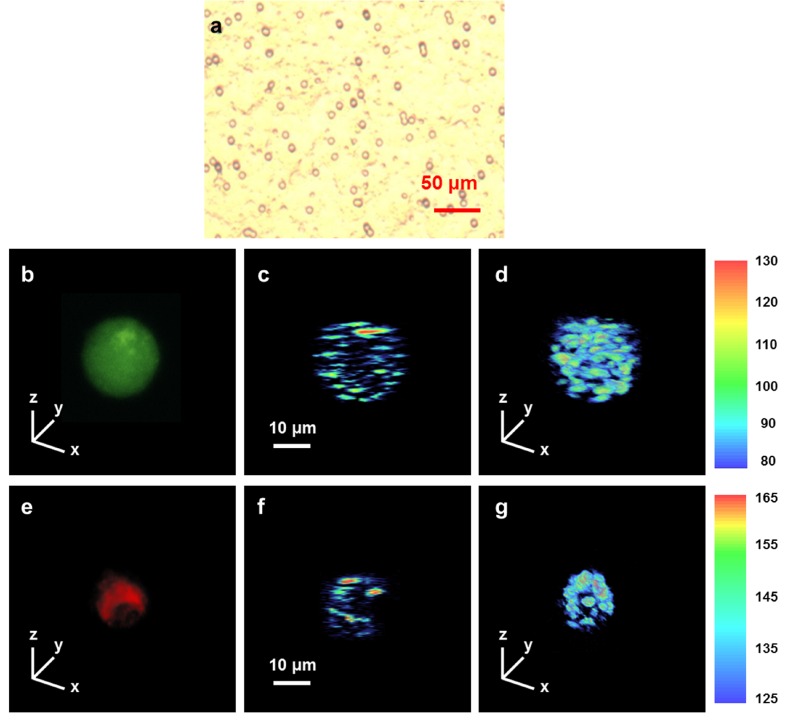
Fig. 3.
Microscopic image of BCC cell line and UR-OCT/confocal microscopy images of live and dead BCC cells. BCC cell line was suspended in Matrigel and imaged by a bright-field microscope (a). Live and dead BCC cells were randomly selected from the sample and scanned by UR-OCT and confocal microscopy. Live cell were encoded in green (b) and dead cell which was were encoded in red (e), according to the calcein and propidium’s fluorescence spectrum. Two-dimensional cross-sectional imaging (c, f) were performed across the center of each cell. Three-dimensional imaging of the whole cell (d, g) were realized by combining several cross-sectional images whose covering range were slightly larger than the size of the cells.

