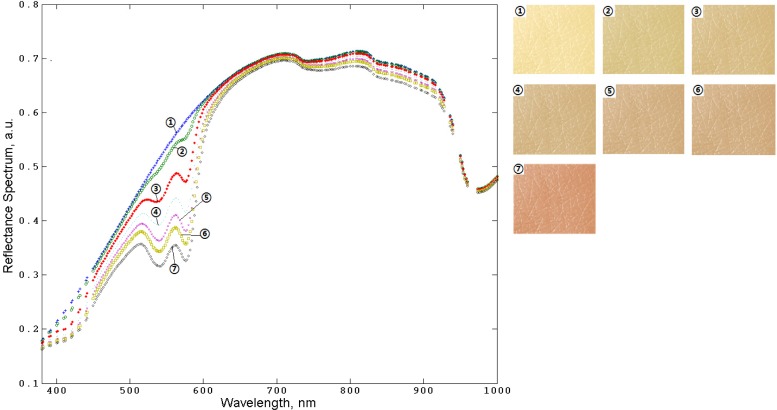
Fig. 8.
The results of MC simulation of human skin spectra (left) and corresponding colors (right) while varying the blood concentration in the layers from papillary dermis to subcutaneous tissue: (1), 0%; (2), 2%; (3), 5%; (4), 10%; (5), 20%; (6), 35%; (7), 70%, respectively. The melanin concentration is 2% and fraction between eumelanin and pheomelanin is 1:3.

