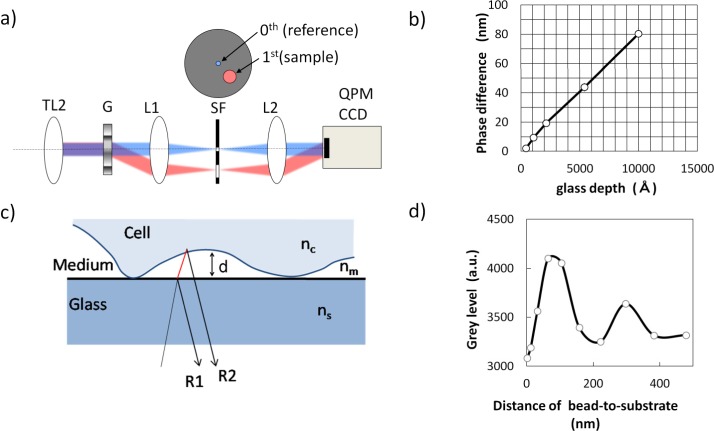
Fig. 2.
The principle of QPM-IRM imaging and quantitative measurement results by using grooved glass slides and polystyrene beads whose physical shapes are known. a) Optical diagram of the quantitative phase imaging unit. TL2: Tube lens, G: Phase grating, SF: Spatial filter, L1 and L2: A couple of relay lenses. b) Linearity of QPM measurement by using grooved glass slides; the measured phase difference is plotted as a function of known physical thickness. c) Schematic diagram of IRM. R1: Reflection light from glass-to-medium interface, R2: Reflection light from medium-to-cell interface. Symbols nc, nm and ns indicate the refractive indices of cell, medium and substrate, respectively. d) IRM intensity plotted as a function of bead-to-substrate distance measured by using a polystyrene bead (10 μm in diameter) attached onto a glass-bottom culture dish.

