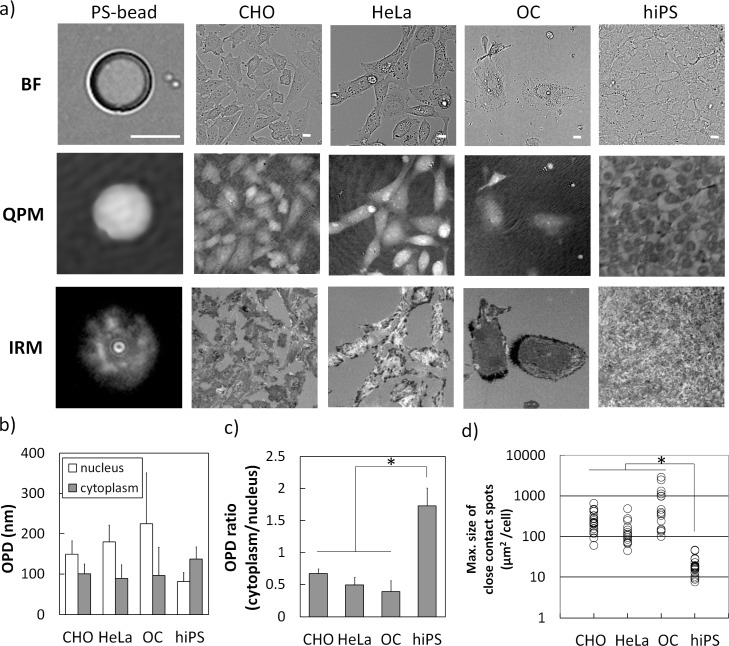
Fig. 3.
QPM-IRM image characteristics of hiPS cells and other types of cells: a) Bright-field (BF) and QPM-IRM images of living cells and 10μm polystyrene bead (PS-bead) were shown. Full grey scale of QPM image indicated OPD of 1 μm. The gray scale of IRM indicated intensity level from 2850 to 3150. The following data were measured from 15 to 20 individual cells (b to d). Scale bar is 10μm. b) The average OPD of nucleus region (white bar) and cytoplasm region (grey bar). Each data was expressed as the mean ± S.D. c) The ratio of cytoplasm-to-nucleus OPD of each cell was expressed as the mean ± S.D. *, P < 0.001. d) The maximal size of close contact spots of each adherent cell was expressed in dot plotted chart (white circles). *, P < 0.001. P means the p-value of the statistical significance test. Refer to subsection 2.4.

