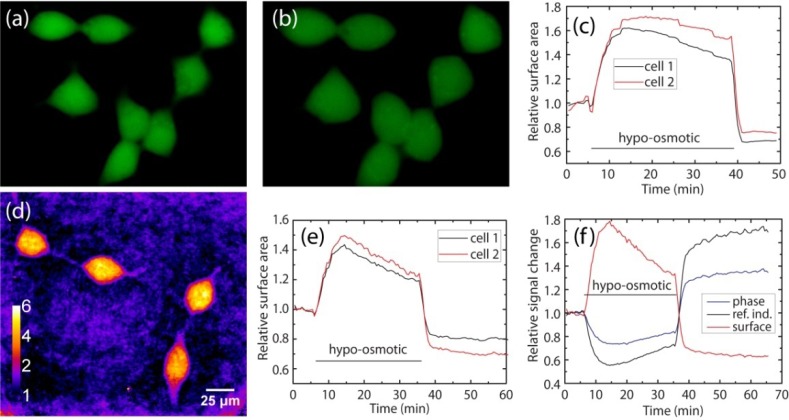
Fig. 3.
(a) Fluorescence image of GFP-labeled HEK293 cells under normal conditions. (b) Fluorescence image of the same cells after hypo-osmotic shock, showing cell swelling. (c) Measured surface area of two cells as a function of time during a hypo-osmotic shock, using fluorescence images. (d) Phase microscopy image of unlabeled HEK293 cells. (e) Measured surface area of two cells as a function of time during a hypo-osmotic shock, using phase microscopy. (f) Phase signal and cell surface area as a function of time. When assuming isotropic expansion, an estimate for the refractive index change can be calculated as well.

