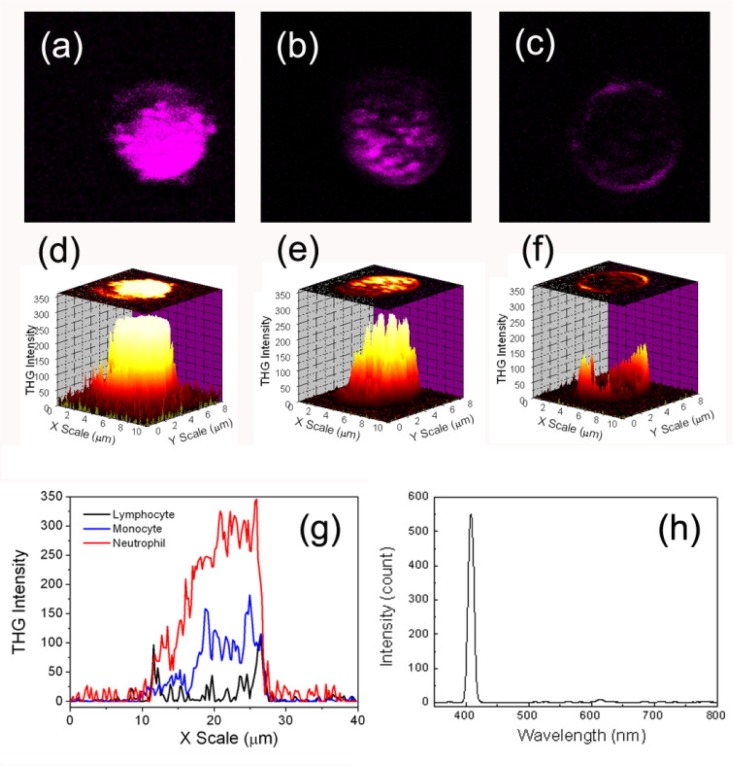
Fig. 1.
Third harmonic generation images (a-c) and 3D surface plots (d-f) of a (a,d) neutrophil, (b,e) monocyte, and (c,f) lymphocyte. Field of view: 12 × 12 μm. (g) Cross sectional view of neutrophil (red curve), monocyte (blue curve), and lymphocyte (black curve). (h) Multiphoton nonlinear optical spectrum of leukocytes under imaging.

