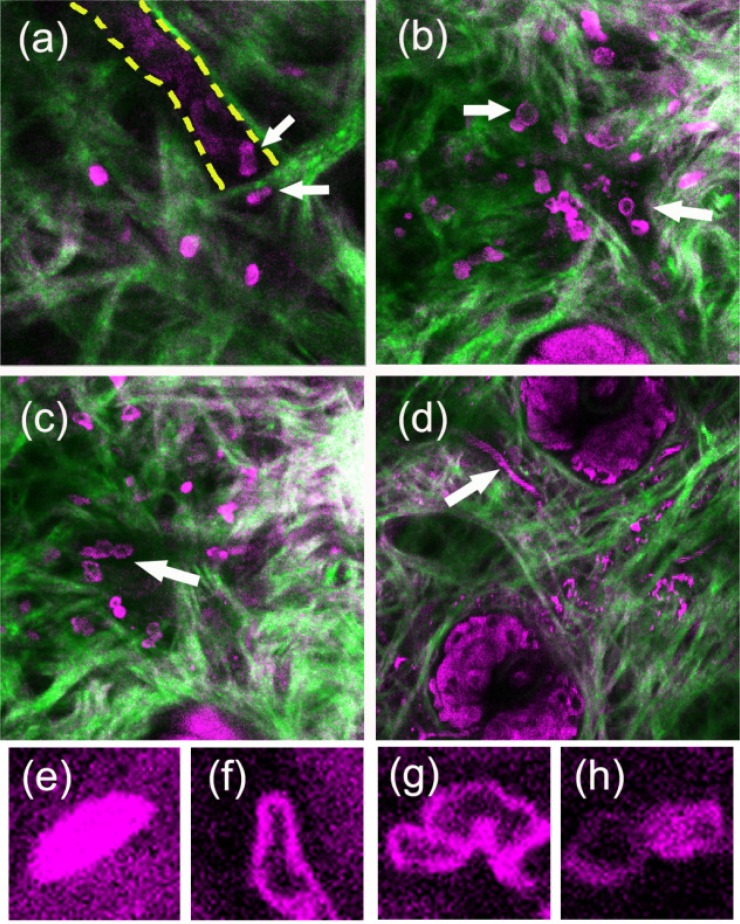
Fig. 4.
Combined second harmonic generation (green color) and third harmonic generation (magenta color) time course images of inflammation microenvironments (a) 6 hours, (b),(c) 3 days, and (d) 6 days post-LPS challenge in the same mouse. White arrows indicate (a) deformed neutrophils, (b) hollow-core lymphoid cells, (c) deformed lymphoid cells, and (d) a vessel with circulating red blood cells. Bottom rows shows THG images of elongated (e) neutrophil and (f) lymphoid leukocytes, (g) ruffled lymphoid leukocytes, and (h) cell-cell contact between granulocytes and lymphoid cells. Fields of view are 120 × 120 μm in (a-d) and 12 × 12 μm in (e-h).

