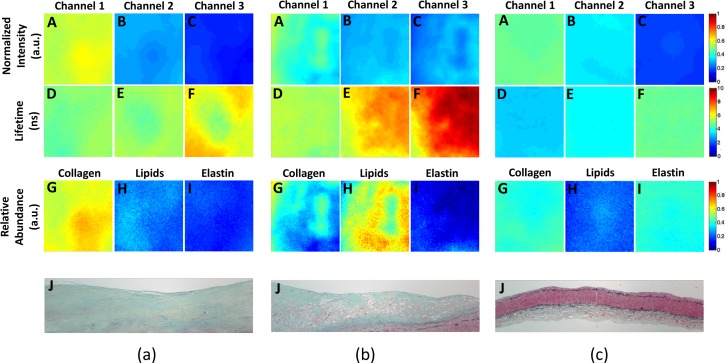
Fig. 9:
Standard FLIM features: normalized intensity and lifetime maps (A–C & D–F resp.) and NMF FLIM features: relative abundance maps (G–I) for three homogeneous samples, one from each (a) High Collagen, (b) High Lipids and (c) Low Collagen/Lipids class. Also shown are the representative histology sections for each class (J).

