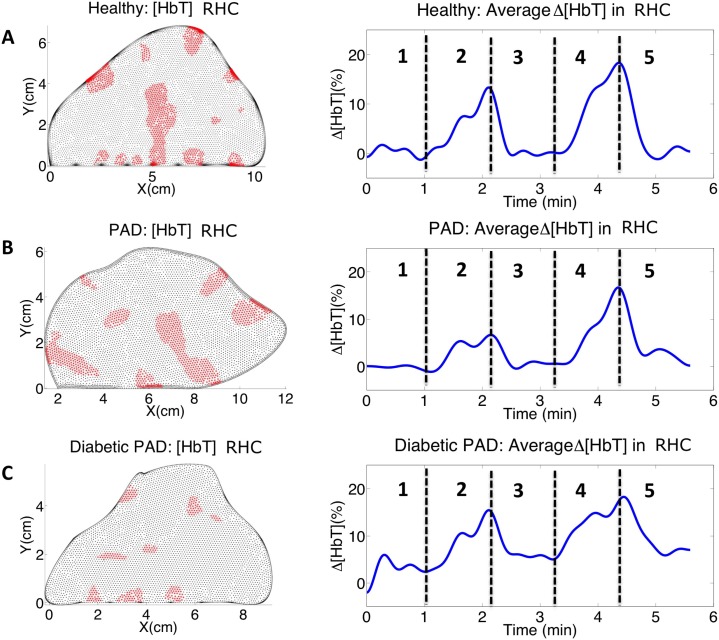
Fig. 8.
Pixels that correlate with weighted average total hemoglobin signal and their corresponding time traces for (A) a healthy volunteer, (B) a PAD patient, and (C) a diabetic PAD patient. By using RHC we see much cleaner signals than the weighted average signals and the differences in the vascular dynamics become much more apparent.

