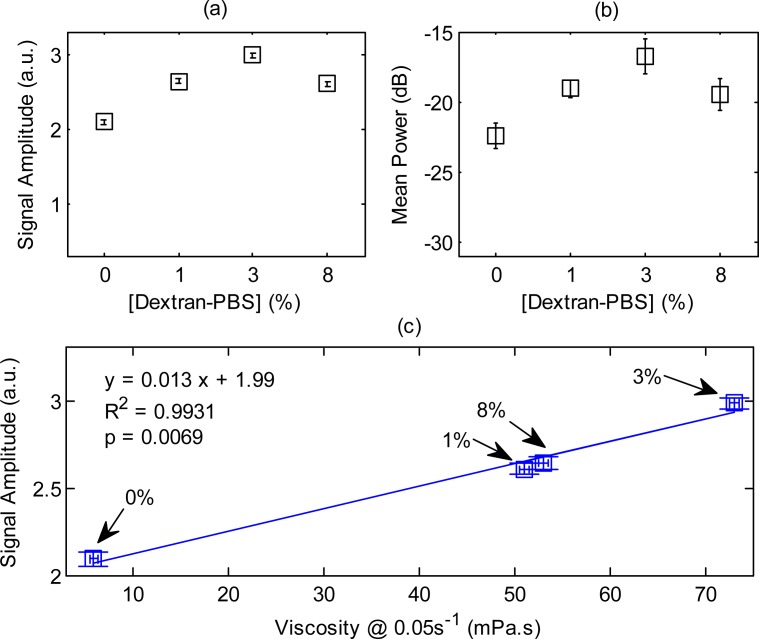
Fig. 6.
(a) PA signal amplitude, (b) mean spectral power and (c) correlation between the signal amplitude and viscosity for h-RBCs at 40% hematocrit. The arrows in (c) denote the [Dextran-PBS] for which the PA signal amplitude and viscosity was measured. The error bars for the PA signal amplitude and mean power denote the standard deviation of 20 PA signals and power spectra.

