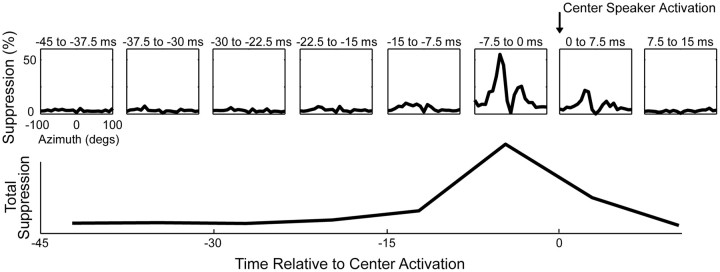
Figure 3.
Magnitude of surround suppression at different latencies relative to the onset of sound at the center. Top, Mean surround modulation (n = 91) varied with time, relative to the stimulus onset at the center speaker (arrow). Bottom, Magnitude of surround suppression estimated by integrating the plots of the top row. Suppression was strongest when surround speakers were activated −7.5 to 0 ms before activation at the center.

