Figure 7.
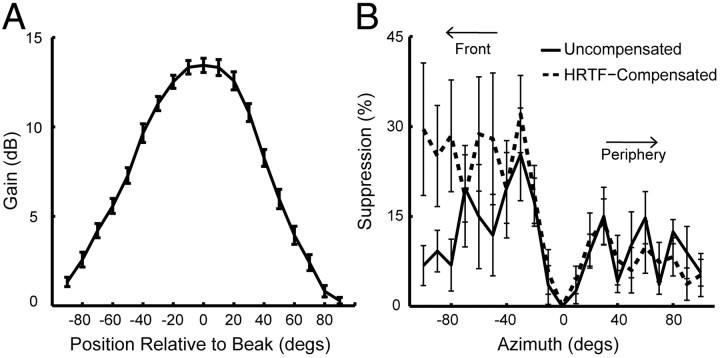
Surround suppression and the HRTF. A, Generic HRTF at 0° elevation obtained by averaging individual HRTFs across frequency from six owls. The function shows that sound intensity gain is greatest in front of the owl's head and decreases with laterality. This curve was used to modify the output of the speaker array so that sounds from different locations should arrive at the eardrums with similar intensity. B, Surround effect as a function of distance from the RF center. For the same neurons, there was no significant difference between RFs measured with (dashed line) and without (solid line) compensating for the HRTF (Kruskal–Wallis test, p > 0.2). Error bars represent SEM.

