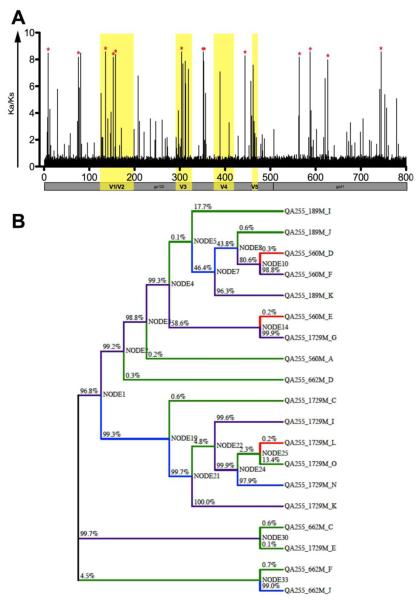
Figure 2. QA255 quasispecies variants evolving under diversifying selection.
(A) Codon-specific analysis of positive selection. The red * indicates a posterior probability greater than 95% of dN/dS >1 (dN/dS described as Ka/Ks). Variable regions are highlighted in yellow. Boundary between gp120 and gp41 regions of gp160 is outlined beneath graph. (B) Phylogeny showing the distribution of estimated dN/dS per lineage. Four categories of dN/dS values (10000, 2.212, 0.633, and 0.219) were approximated according to the best-fitting model. Lineages are color-coded based on their assignment to each of these dN/dS categories and the percentage represents the posterior probability that dN/dS > 1.

