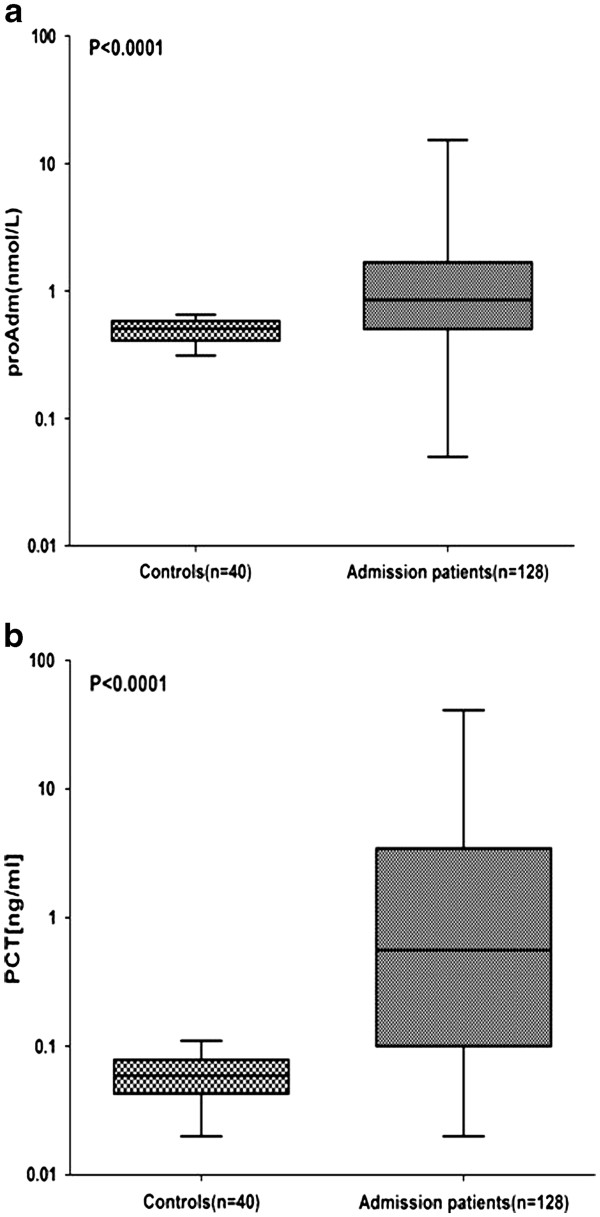
Figure 1 .
Levels of MR-proADM and PCT at admission. (a) MR-proADM in all patients versus healthy control individuals. (b) PCT in all patients versus healthy control individuals. Lines denote median values, boxes represent 25–75th percentiles and whiskers indicate the range. The numbers of samples are indicated in parentheses. proADM: mid-regional pro-adrenomedullin; PCT: procalcitonin.

